September 08, 2020CANADIAN INCOME SURVEY, 2018 REVISIONS TO POVERTY RATE With revisions to thresholds for the Market Basket Measure (MBM) of poverty, Statistics Canada has restated poverty rates across Canada. Incomes for the 2018 reference year reported in the Canadian Income Survey are unchanged, but the increased threshold reclassifies additional families and individuals as experiencing poverty. Poverty rates have been re-estimated back to 2015 using the 2018 base for the MBM.
Poverty Rates
The Market Basket Measure estimates the share of the population that do not have sufficient income to afford the cost of a basket of essential goods and services. The MBM threshold is estimated for specific communities. In Nova Scotia, there are separate thresholds for MBM in Halifax, Cape Breton, communities with populations between 30,000 and 100,000, communities with populations under 30,000 and rural areas.
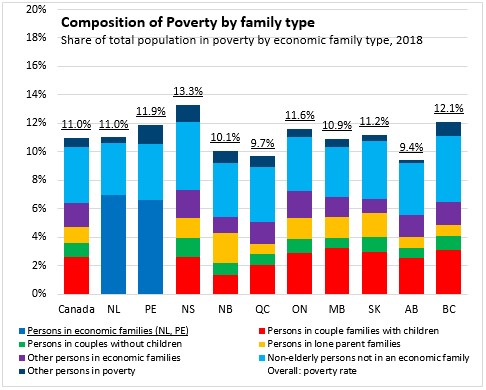
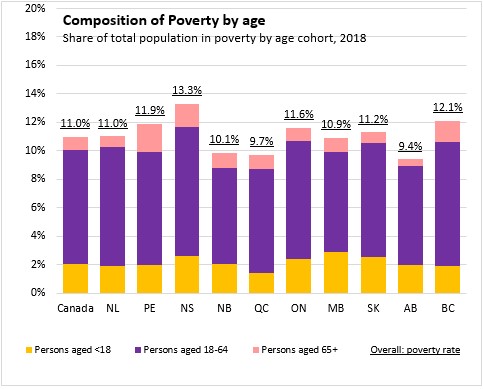
According to the Canadian Income Survey, 13.3 per cent of Nova Scotians lived with income below the poverty line established by the MBM threshold, revised up from the previous estimate of 10.3 per cent under the 2008 base for MBM thresholds. Nova Scotia has the highest poverty rate among provinces, followed by British Columbia and Prince Edward Island. Nationally, 11.0 per cent of the population had income below the MBM threshold with a low of 9.4 per cent in Alberta.
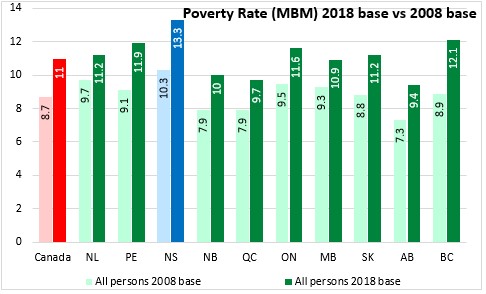
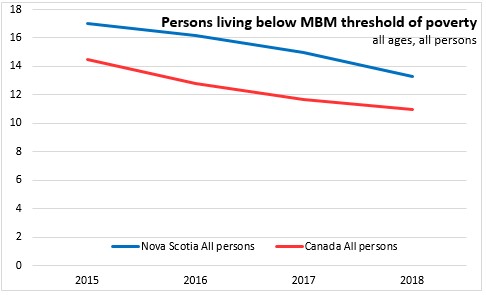
Poverty rates have been declining for several years in Canada and Nova Scotia. Although the revisions to the MBM thresholds increase the poverty rate in each year, the declining trend in poverty remains.
The largest group of persons in poverty in Canada is found among those who are not in economic families. Although poverty rates are similar for lone parent families, this group makes up a smaller share of the population and therefore a smaller portion of Canadians in poverty. Couple families (with children or without) typically have lower poverty rates, but they are a large portion of Canada's population and therefore make up a sizable number of Canadians in poverty.
The bulk of Canadians in poverty are aged 18-64. The poverty rate among seniors is lower while the poverty rate among children is higher.
Among family structures, Nova Scotia's share of persons in economic families living below the MBM threshold of poverty was 8.9 per cent in 2018, revised up from 6.9 per cent under the previous (2008) MBM thresholds. Nova Scotia's poverty among economic families is the highest among provinces. Poverty rates for persons in economic families were revised up in every province.
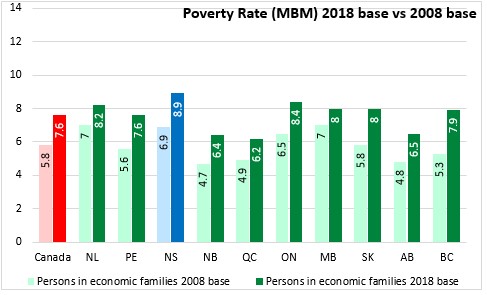
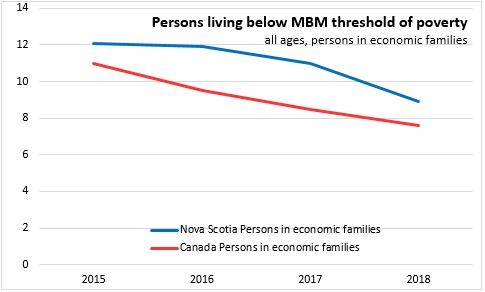
The poverty rate among Nova Scotia's economic families has declined in the last two years, closing the gap with the national average.
Within economic families, the share of Nova Scotia couples (non-elderly, without children or other relatives) living below the MBM threshold of poverty was 8.4 per cent, revised up from 6.9 per cent. Non-elderly couples without children generally have lower poverty rates than for all economic families.
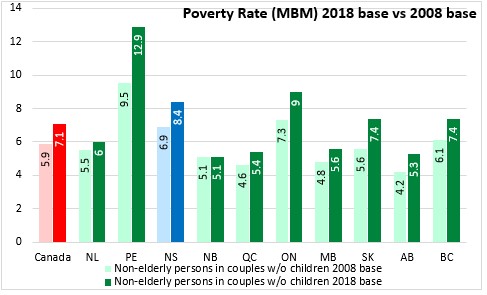
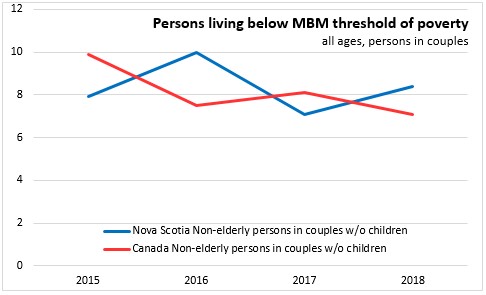
Nova Scotia's poverty rate among couple familes without children increased from 2017 to 2018
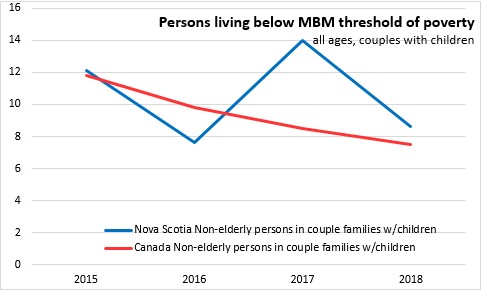
In 2018, 8.6 per cent of Nova Scotia couple families with children lived with income below the poverty line. This was revised up from 6.9 per cent under the 2008 base.
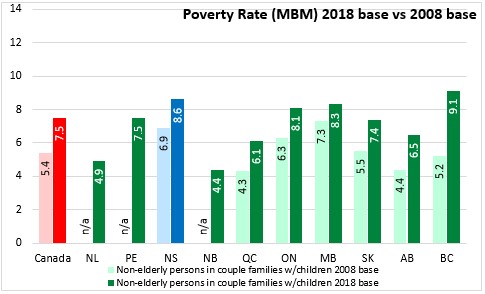
In 2017, there was a large increase in the number of people in couple families with children living under the poverty threshold. However, by 2018, the gap narrowed between poverty rates for couple families with children in Nova Scotia and Canada.
Lone parent families across the country report a higher share of the population living below the MBM threshold of poverty. In 2018, 29.3 per cent of persons in lone parent families in Nova Scotia lived below the MBM poverty line. This is revised up from 25.5 per cent measured using the 2008 base. Poverty among lone parent families has been revised up substantially in most provinces (data for Prince Edward Island are unavailable).
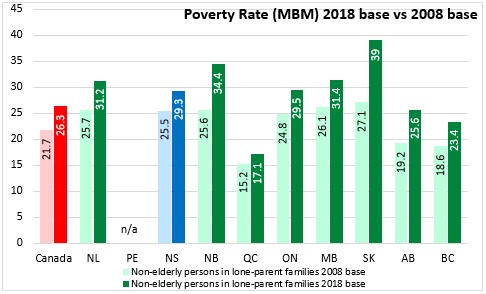
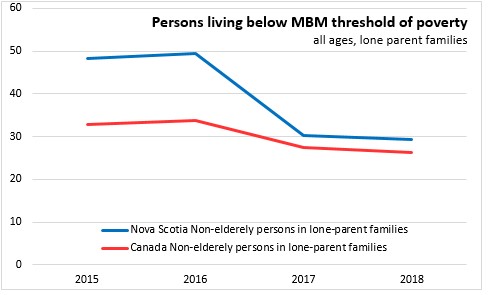
In 2017 and 2018, the poverty rate for lone parent families has declined significantly, particularly for Nova Scotia. In 2016, 49.4 per cent of Nova Scotians in lone parent families lived in poverty. In the next two years, this share declined by over 20 percentage points.
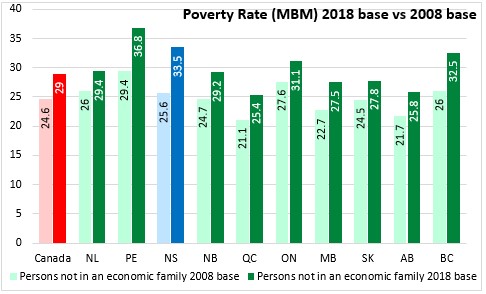
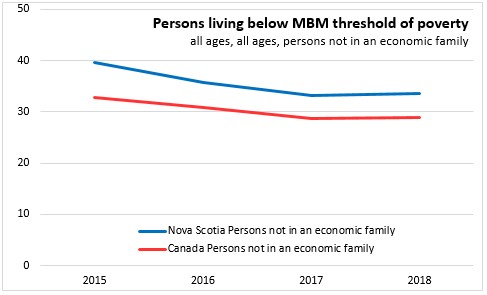
Those living outside of economic families report higher poverty rates than those living in economic families. In 2018, 33.5 per cent of the population of Nova Scotians not in economic families had income below the MBM poverty line, revised up from 25.6 per cent under the 2008 base for the MBM threshold.
In 2016 and 2017, poverty rates among those not in an economic family declined, but this progress stopped in 2018.
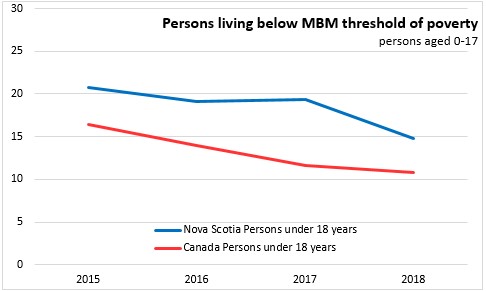
The share of Nova Scotia children in families with incomes below the MBM has been revised up from 12.1 per cent under the 2008 base to 14.8 per cent under the 2018 base for the threshold. Nova Scotia's rate of children in poverty remains the highest among provinces. Child poverty has been revised up in all provinces, with the largest increase in British Columbia.
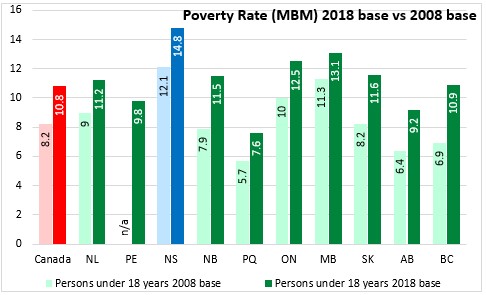
After stalling in 2017, Nova Scotia's child poverty declined again in 2018.
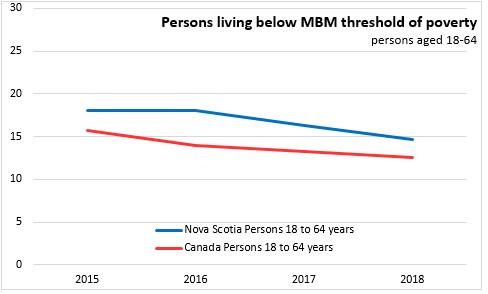
The share of Nova Scotia's population aged 18-64 living below the MBM threshold of poverty was 14.6 per cent, highest among provinces.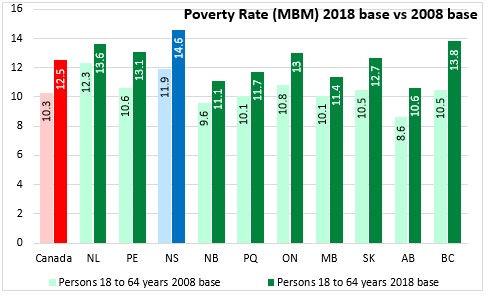
The share of Nova Scotians aged 18-64 living in poverty has declined in each of the last two years.
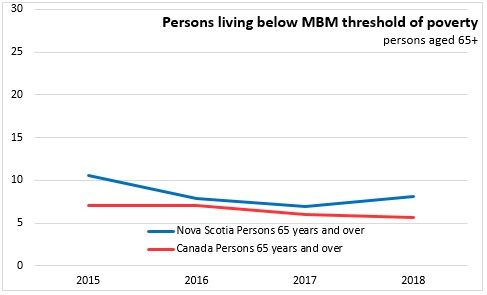
The share of senior citizens (aged 65+) living below the MBM is lower than it is for other age cohorts in Nova Scotia, but there has been a substantial upward revision, from 3.5 per cent under the 2008 base to 8.1 per cent under the 2018 base for the threshold. The revisions resulted in a higher share of seniors poverty in every province.
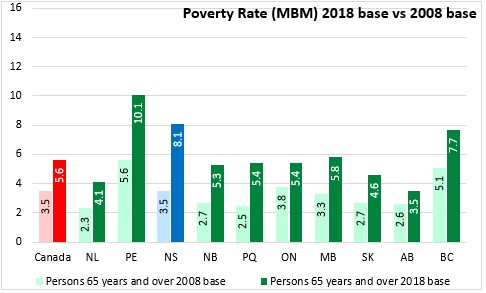
The poverty rate among seniors increased in Nova Scotia in 2018.
Notes and definitions
The Canadian Income Survey estimates are based on probability samples and are therefore subject to sampling variability. As a result, estimates will show more variability than trends observed over longer time periods.
The market basket measure (MBM) of poverty is based on the cost of a specific basket of goods and services representing a modest, basic standard of living. It includes the costs of food, clothing, footwear, transportation, shelter and other expenses for a reference family. These costs are compared with the disposable income of families to determine whether or not they fall below the poverty line. The definitions for the basket of goods and services have been updated as of the 2018 reference year (see separate article in today's DailyStats).
An economic family refers to a group of two or more persons who live in the same dwelling and are related to each other by blood, marriage, common-law union, adoption or a foster relationship. This concept differs from the census family concept used for subprovincial data in the Annual Income Estimates for Census Families and Individuals.
Sources: Statistics Canada, Canadian Income Survey:
Table 11-10-0135-01 Low income statistics by age, sex and economic family type
Table 11-10-0136-01 Low income statistics by economic family type