February 05, 2016LABOUR MARKET TRENDS - JANUARY 2016 TRENDS
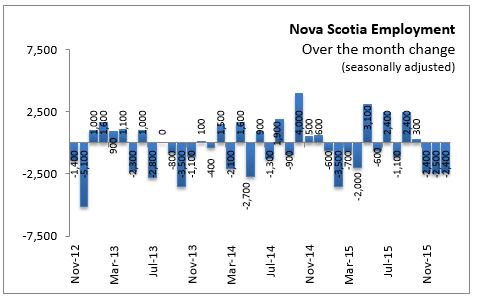
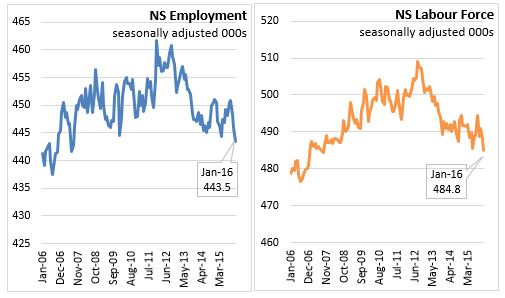
Nova Scotia's seasonally adjusted employment dropped by 2,400 to 443,500 in January. This is the third month in a row for a decline in the level employment. Before November there was an up and down pattern in Nova Scotia’s employment through the spring and summer months. It should be noted, however, that 2015 also started with a similar trend.
Compared to December, the labour force has decreased by 3,300 to 484,800 in January. With labour supply falling a faster pace than labour demand, the net result was a 0.1 percentage point decrease in the seasonally adjusted unemployment rate to 8.5 percent in January. Because of the decrease in labour supply, the participation rate dropped by 0.4 percentage points to 61.6 per cent. With fall in employment there was a drop in the employment rate by 0.4 percentage points to 56.3 per cent.

In January, the decline in employment reflected a combination of 500 new part-time jobs and 2,900 fewer full-time jobs. Note that changes in hours can include the switching back and forth in full and part time employment.
Compared with January 2015, the labour force has decreased by 6,800 (-1.4 percent) while employment decreased 7,000(-1.6 per cent). Full-time employment levels in January are down 3,300 from a year ago, and part-time is down a further 3,700 than in 2015. Overall, with labour demand decreasing faster than the increase in labour supply, the end result was a 0.1 percentage point increase in seasonally adjusted unemployment rate to 8.5 per cent.
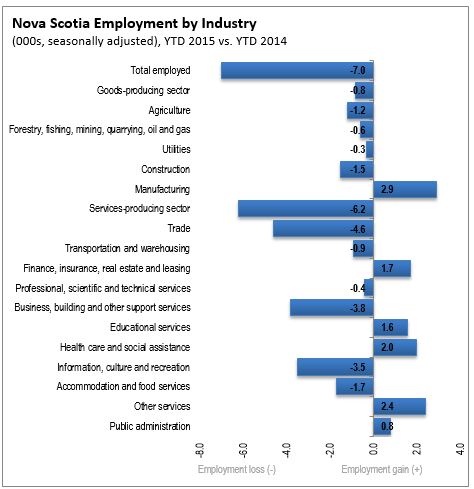
SECTORS (YTD: January 2016 over January 2015)
Comparing January 2016 to January 2015, employment in goods-producing sectors fell by 800 jobs. The increase in manufacturing employment was not enough to override the declines in all the other good producing sectors. There was a net loss in employment of 6,200 in service-producing sectors. Employment gains in the other services, health care, educational services, finance, insurance and real estate services could not override the declines in employment for the other service producing sectors especially trade (retail and wholesale).
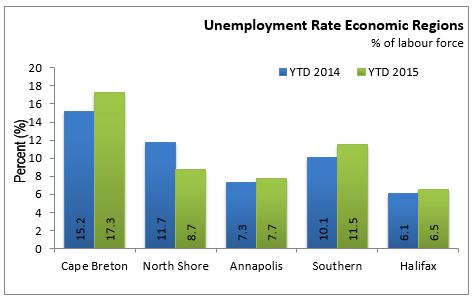
REGIONS (YTD: January 2016 over January 2015)
The Valley region and the North Shore region were the only regions to report an increase in employment among the province's five economic regions comparing January 2016 to January 2015. The same two regions were the only regions to have increases in their labour supply over the same period. Unemployment rates however, were only down in the North Shore region.
The Cape Breton region reported a decrease in employment of 6,200 for January 2016 over January 2017. The labour force dropped by 6,000 for the same period. With employment decreasing at a faster pace, the end result was a 2.1 percentage increase in the unemployment rate 17.3 per cent.
For the North Shore region, employment increased 7,400 comparing January 2016 over January 2015. Labour supply was up by 5,800 for the same period. The larger increase in labour demand caused a 3.0 percentage point decrease in the unemployment rate to 8.7 per cent.
The Annapolis region experienced an increase of 1,200 in employment while the labour force had an increase of 1,400 for January 2016 over January 2015. The net result was a 0.4 percentage point increase in the unemployment rate to 7.7 per cent.
The Southern region saw employment drop by 3,100 and the labour force to fall by 2,600 for January 2016 over January 2015. With the labour demand falling at a faster pace, the end result was an increase in the unemployment rate of 1.4 percentage points to 11.5 per cent.
Halifax (HRM) experienced a drop of 3,900 in employment while there was a further drop of 3,100 in the labour supply comparing January 2016 to January 2015. With employment dropping at a faster than be labour supply, net impact was 0.4 percentage point increase in the unemployment rate to 6.5 per cent.
PROVINCIAL COMPARISONS
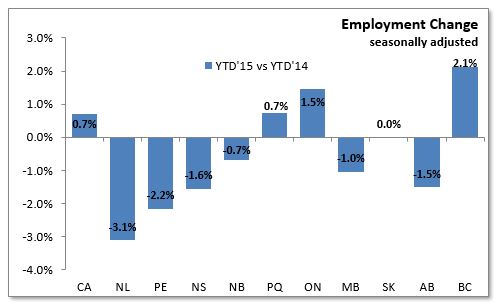
Employment growth increased 0.7 per cent in Canada comparing January 2016 with January 2015. The fastest growth was in British Columbia (+2.1%) with employment continuing an upward trend. Ontario (+1.5%) and Quebec (+0.7%) increased with gains due to full-time employment. All the other provinces had declines compared to January 2015. The largest declines occured in Newfoundland and Labrador (-3.1%) and Prince Edward Island (-2.2%).
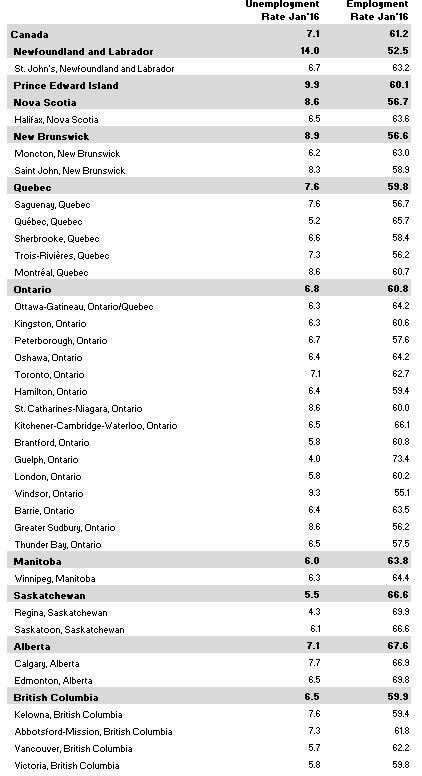
Nova Scotia unemployment rate was down 0.1 percentage points to 8.5 per cent in January 2016. In January 2015, Nova Scotia unemployment rate was 8.4 per cent. Three provinces: Prince Edward Island, New Brunswick and Ontario have lower unemployment rates in January 2016 than January 2015. The largest increase in the unemployment rate over the past year was in Newfoundland (+2.9 percentage points), Alberta (+2.8 percentage points), and Saskatchewan (+1.1 percentage points).

National Comparisons: Cities
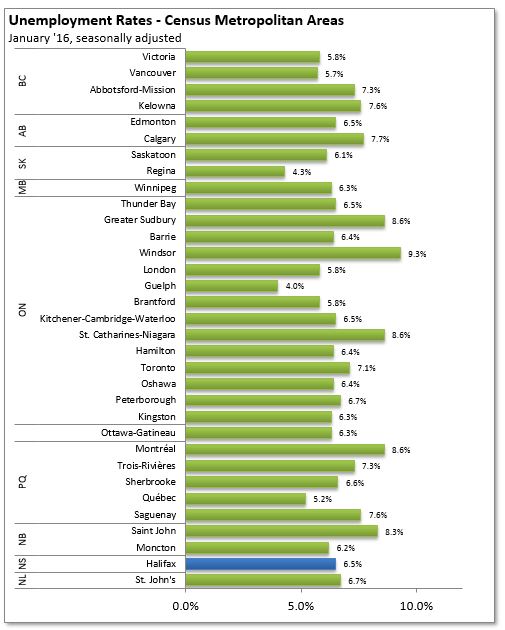
The seasonally adjusted unemployment rate for the Halifax Census Metropolitan Area was 6.5 per cent. Guelph (4.0%) had the lowest unemployment rate in Canada this month.
The seasonally adjusted employment rate for the Halifax Census Metropolitan Area decreased to 63.6 per cent in January 2016.
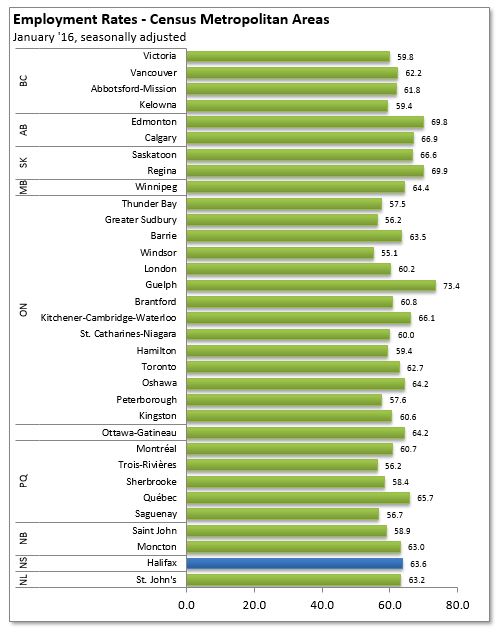
Employment in the Halifax CMA was unchanged in January 2016 compared to last month. The largest gain from month to month in CMAs was in Oshawa, Ontario, where employment rose by 2.5 per cent over the previous month.

Note: Seasonally adjusted, 3 month average.