For additional information relating to this article, please contact:
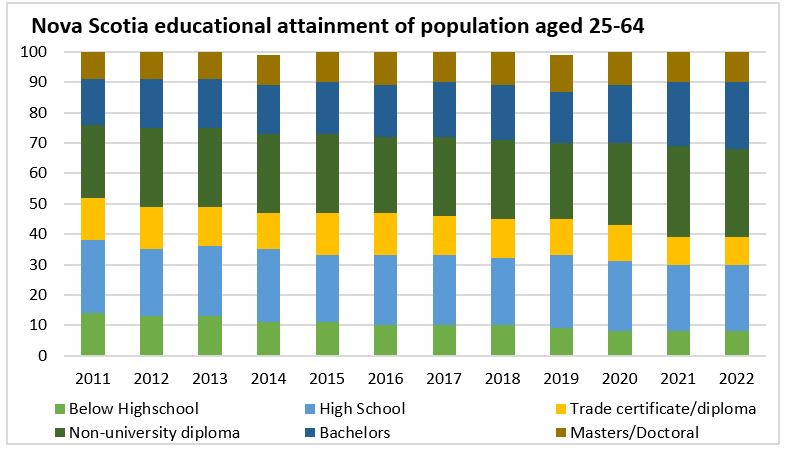
March 28, 2023EDUCATION INDICATORS Over the past ten years the distribution education attainment in Nova Scotia has shifted towards a more educated population. The portion of the population non-university diploma has been increasing while the portion with a trade certificate has been decreasing over the past ten years. The percentage of population with less than high school education has declined. The share of the population with Bachelors degree has increased from 15% in 2011 to 22% in 2022.
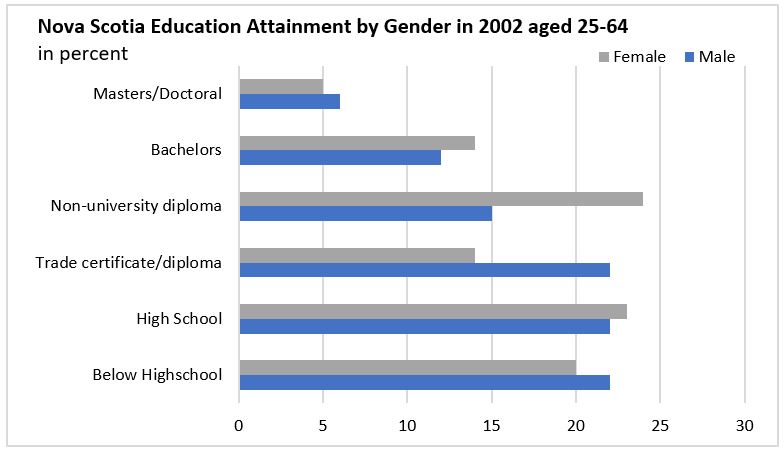
In 2002, there were significantly more women with a non-university diploma than there were men with the same level of education. Men are more likely than women to be in trade certificate category as well as below highschool levels of education. Overall, there were significantly more people with a lower level of education than with a bachelors, masters or a doctoral in 2002.
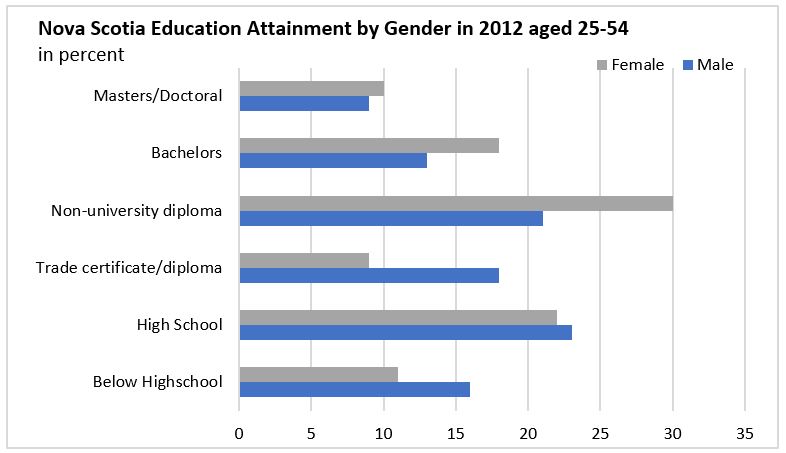
By 2012, there is a shift towards higher education with women leading in all categories above a non-university diploma. Men continued to surpass women in trade certificate, high school and below high school education levels.
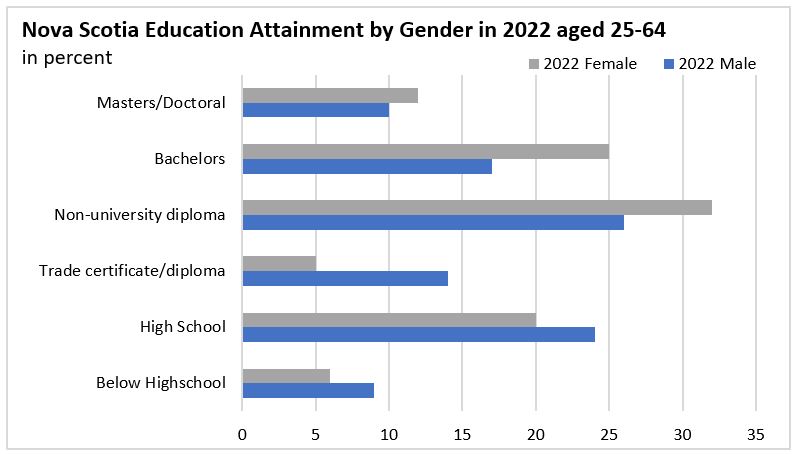
In 2022, the shift continued to more people getting higher education. There were more females than males with non-university diplomas, bachelors, master's and doctoral education.
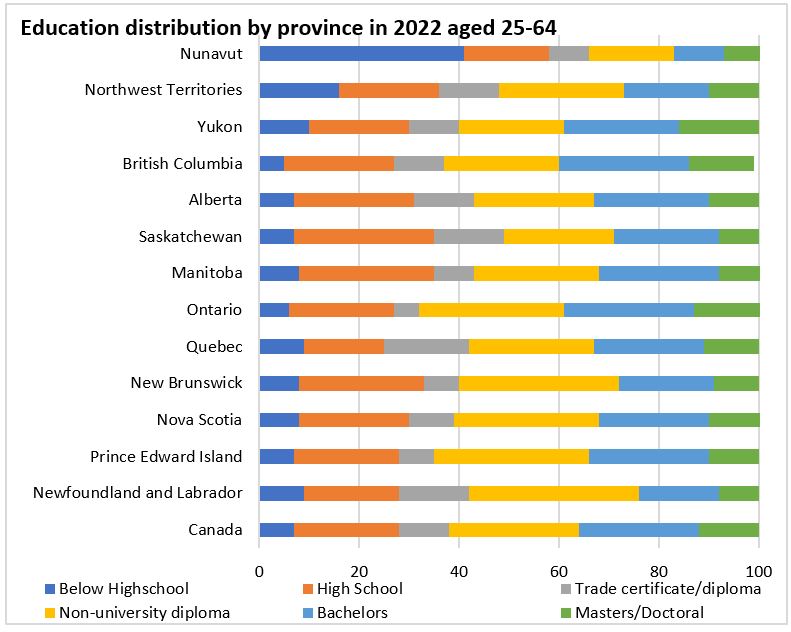
In 2022, 33% of Nova Scotian's aged 25-64 had a bachelor's, master's or doctoral degree, below the Canadian average of 36%. Ontario had the highest percentage at 40%. Trade certificate or apprenticeship training education was most common in Quebec at 17%.
The percentage youth (aged 15-29) not in employment, education, or training (NEET) in Canada has shown a decrease from 2000 to 2008. The percentage grew slightly in 2009 and remained stable for females and fluctuated for males. In 2018, there were more males than females not in employment, education or training in Canada. Both percentages for males and females declined sharply in 2022.
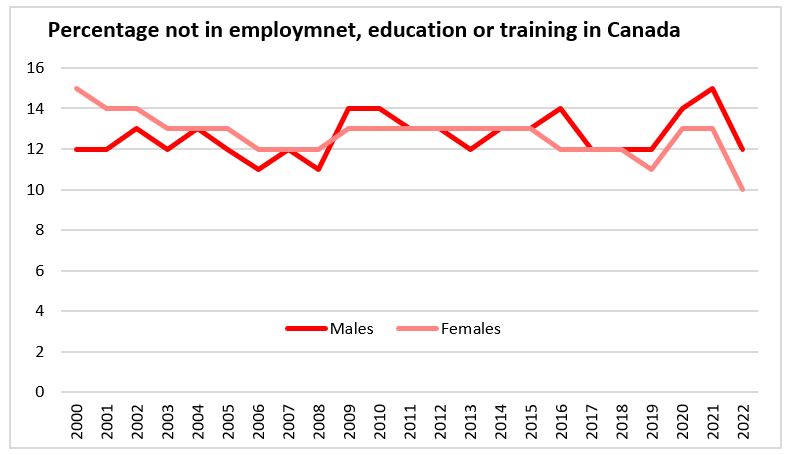
In Nova Scotia, the percentage of youth NEET has been fairly consistent and males consistenly more likely than females to fall into the category. Both males and female NEET share declined in 2021 and 2022.

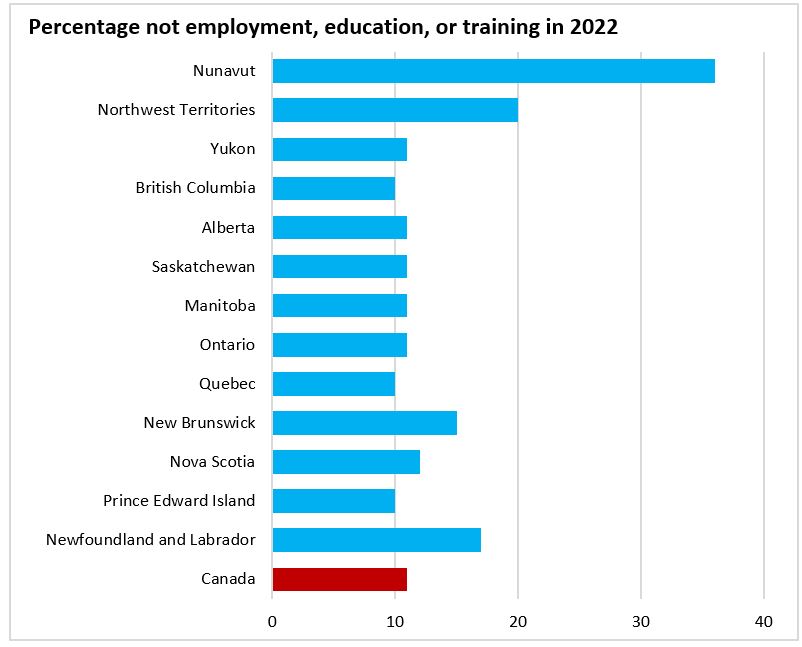
Compared to other provinces, Nova Scotia was the fifth highest province with percentage of those in NEET, above the national average. Nunavut had the highest while Quebec, British Columbia, and Prince Edward Island had the lowest NEET.
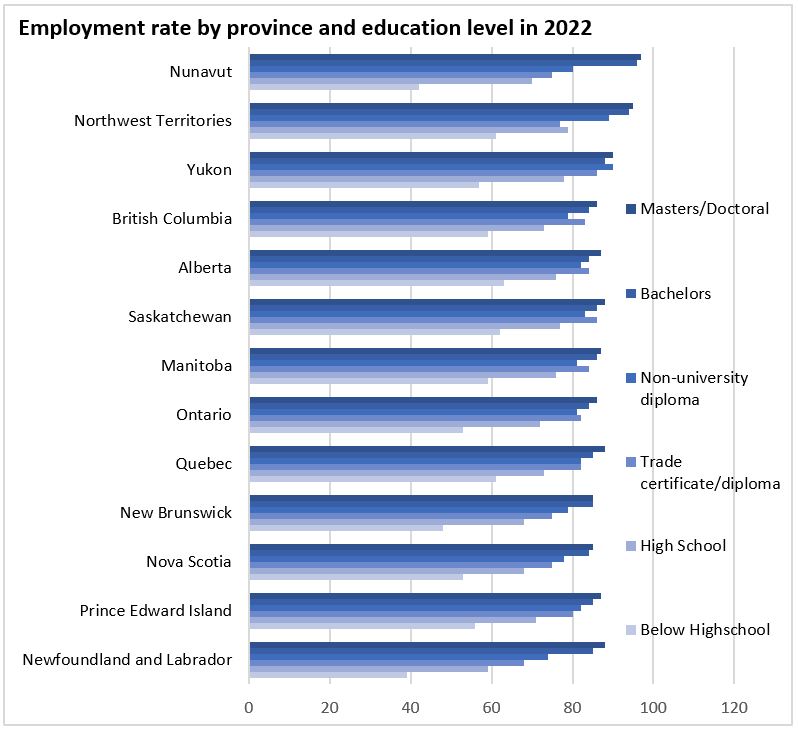
Over the past ten years, there has been consistent pattern of higher education and higher employment rates.
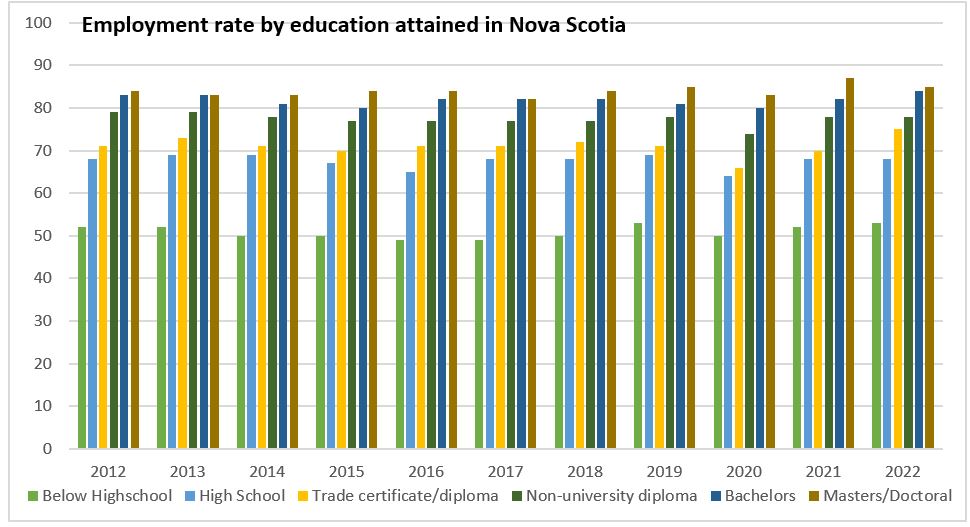
Among the Atlantic provinces, Nova Scotia had similar employment rates for masters/doctoral as New Brunswick, however, Newfoundland and Labrador had the highest employment of those holding a bachelors or masters/doctoral degrees.
Source: Statistics Canada. Table 37-10-0130-01 Educational attainment of the population aged 25 to 64, by age group and sex, Organisation for Economic Co-operation and Development (OECD), Canada, provinces and territories, Table 37-10-0197-01 Employment rates of 25-to 64-year-olds, by highest level of education attained, age group and sex, Table 37-10-0196-01 Percentage of 15-to 29-year-olds in education and not in education by labour force status, highest level of education attained, age group and sex