For additional information relating to this article, please contact:
February 21, 2020FOOD SERVICES AND DRINKING PLACES, DECEMBER AND ANNUAL 2019 Month over Month
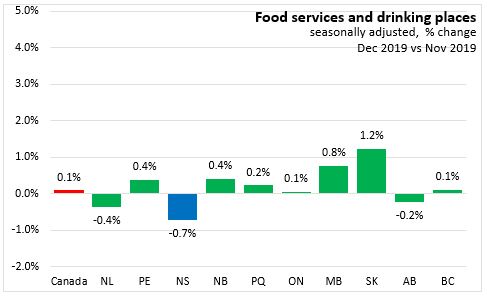
In December 2019, Statistics Canada on a month-over-month basis, reported that food services and drinking places receipts (seasonally adjusted) in Nova Scotia decreased 0.7 per cent to $146.7 million over November 2019. Food services and drinking places receipts (seasonally adjusted) in Canada increased 0.1 per cent to $6.3 billion over November 2019. Seven provinces reported monthly increases in food services and drinking places, with Saskatchewan (+1.2%) reporting the largest gain, and Nova Scotia (-0.7%) reporting the largest decline in percentage terms.
Year-over-Year
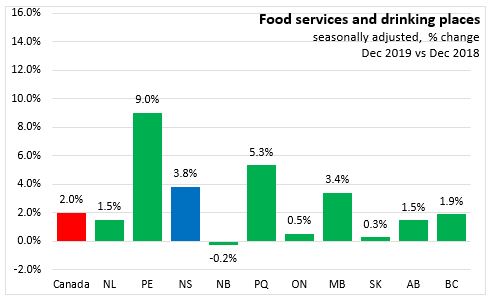
In December 2019, on a year-over-year basis, food services and drinking places receipts (seasonally adjusted) in Nova Scotia increased 3.8 per cent over December 2018. Food services and drinking places receipts (seasonally adjusted) in Canada increased 2.0 per cent over December 2018. Nine provinces reported year-over-year increases in food services and drinking place receipts, with Prince Edward Island (+9.0%) reporting the largest gain and New Brunswick (-0.2%) reporting the only decline.
ANNUAL
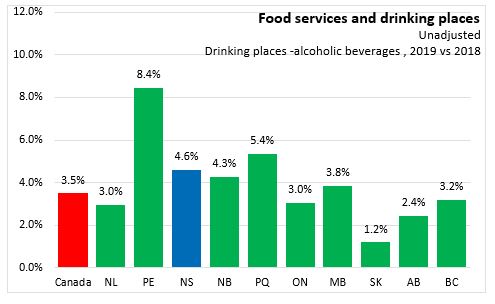
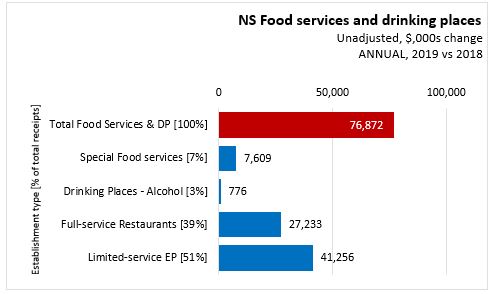
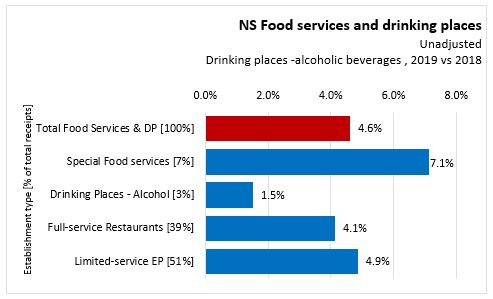
In 2019, Nova Scotia unadjusted food services and drinking places increased 4.6 per cent ($76.9 million) over 2018 to $1.7 billion. Food services and drinking places receipts (unadjusted) in Canada increased 3.5 per cent (+$2.5 billion) over 2018 to $74.4 billion. In 2019, all provinces reported increases in food services and drinking place receipts, with Prince Edward Island (+8.4%) reporting the largest gain and Saskatchewan (+1.2%) reporting the smallest gain in percentage terms.
Long-run Trend
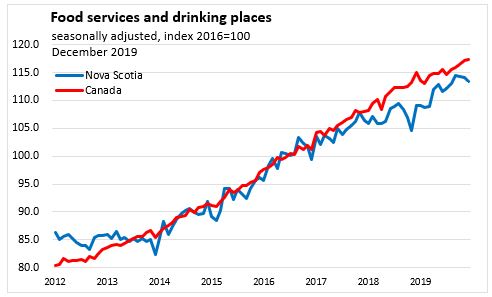
Although Nova Scotia’s food service and drinking place receipts exhibit somewhat more volatile growth from one month to the next, the provincial trend was in line with national over 2014 to 2017. Throughout 2018 and early 2019 Canada's growth in food services and drinking place receipts was faster, but in the spring and summer Nova Scotia’s food service and drinking place receipts started to catch up with national growth. In September 2019, food services and drinking places reached a new high in Nova Scotia, but have declined in recent months.
Nova Scotia Annual Sales by Establishment Type
Among types of establishments,
-
Full-service restaurants (39% of total Food services and drinking places) increased 4.1 per cent ($27.2 million) to $686 million.
-
Special food services (7% of total Food services and drinking places) increased 7.1 per cent ($7.6 million) to $115 million.
-
Drinking places -alcoholic beverages (3% of total Food services and drinking places) increased 1.5 per cent ($0.8 million) to $52 million.
BACKGROUND: FOOD SERVICES AND DRINKING PLACES
Each month, Statistics Canada reports on receipts of food services and drinking places for Canada and the Provinces. Food service and drinking place receipts are seasonally adjusted. More detailed data on receipts by type of establishment are available monthly, but these are not seasonally adjusted so only year-over-year or year-to-date analysis is appropriate.
Food service and drinking place establishments include:
- full-service restaurants, where patrons order and are served while seated and pay after eating
- limited-service eating places, where patrons order/select items at a counter and pay before eating either on premises or as take-out
- special food services, such as institutional food contractors, caterers or mobile food providers
- drinking places, primarily engaged in serving alcoholic beverages for immediate consumption (though they sometimes provide limited food services as well)
Source: Statistics Canada. Table 21-10-0019-01 Monthly survey of food services and drinking places (x 1,000)