For additional information relating to this article, please contact:
February 05, 2020NOVA SCOTIA - INTERNATIONAL MERCHANDISE TRADE ANNUAL 2019 ANNUAL (2009 to 2019, customs-based, unadjusted)
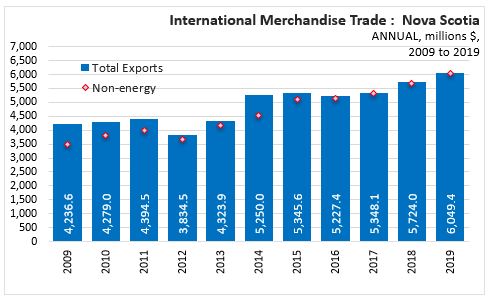
In 2019, Nova Scotia International Merchandise Trade Exports increased 5.7% ($325.4 million) over 2018, to $6.0 billion.
ANNUAL - By Sector
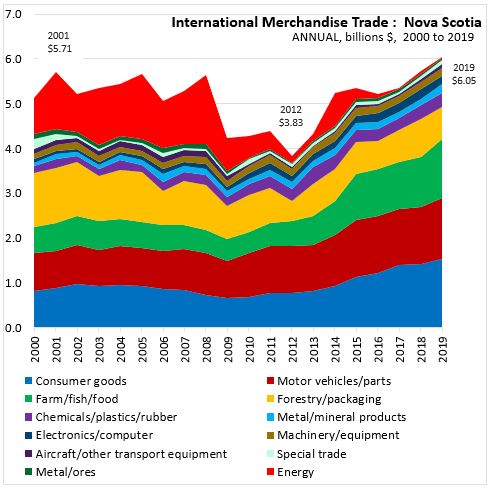
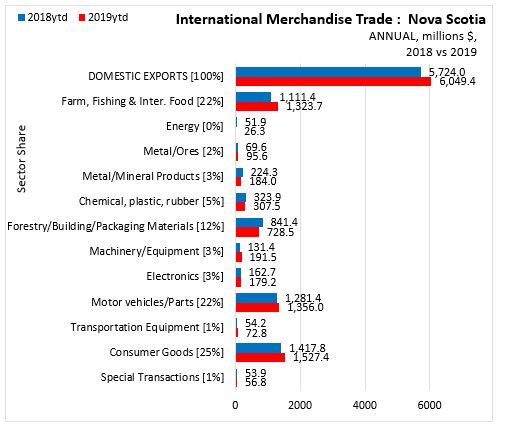
In 2019, Nova Scotia exports reached a new high at $6.05 billion. This is the second year in a row in which Nova Scotia's exports have surpassed previous highs from 2008 and 2001. During the period from 2000 to 2008 energy products were a significant contributor to total exports. Since 2008, energy exports have declined to near zero levels, but other commodities have increased to fill the gap.
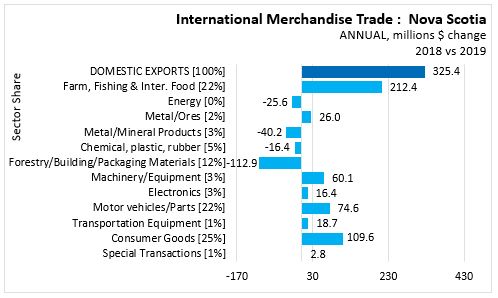
Comparing Nova Scotia's exports for 2019 vs 2018, the largest dollar value increases were in Farm, Fishing & Intermediate Food products ($212.4 million), Consumer Goods ($109.6 million), and Motor vehicles/Parts ($74.6 million). The largest dollar value decreases were in Forestry/Building/Packaging Materials ($112.9 million), Metal/Mineral Products ($40.2 million), and Energy ($25.6 million).
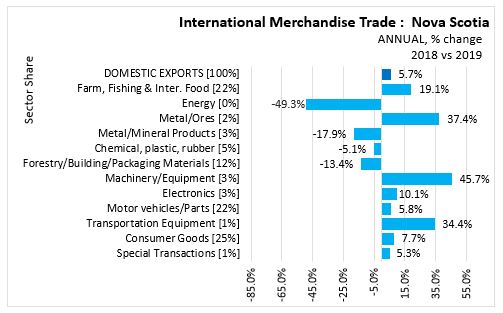
In Nova Scotia on an annual basis, export values increased in
- Machinery/Equipment by 45.7% ($60.1 million)
- Metal/Ores by 37.4% ($26.0 million)
- Transportation Equipment by 34.4% ($18.7 million)
- Farm, Fishing & Inter. Food by 19.1% ($212.4 million)
- Electronics by 10.1% ($16.4 million)
- Consumer Goods by 7.7% ($109.6 million)
- Motor vehicles/Parts by 5.8% ($74.6 million)
- Special Transactions by 5.3% ($2.8 million) and,
export values decreased in
- Chemical, plastic, rubber by 5.1% (-$16.4 million)
- Forestry/Building/Packaging Materials by 13.4% (-$112.9 million)
- Metal/Mineral Products by 17.9% (-$40.2 million)
- Energy by 49.3% (-$25.6 million).
In Nova Scotia 2019, international export trade to all countries increased 5.7% to $6.0 billion over J2018.
- Consumer Goods were the largest export with a value of $1,527.4 million (25 % share), followed by
- Motor vehicles/Parts with a value of $1,356.0 million (22 % share),
- Farm, Fishing & Inter. Food with a value of $1,323.7 million (22 % share),
- Forestry/Building/Packaging Materials with a value of $728.5 million (12 % share),
- Chemical, plastic, rubber with a value of $307.5 million (5 % share),
- Machinery/Equipment with a value of $191.5 million (3 % share),
- Metal/Mineral Products with a value of $184.0 million (3 % share),
- Electronics with a value of $179.2 million (3 % share),
- Metal/Ores with a value of $95.6 million (2 % share),
- Transportation Equipment with a value of $72.8 million (1 % share),
- Special Transactions with a value of $56.8 million (1 % share), and ,
- Energy with a value of $26.3 million (lessthan 1 % share).
Annual by Province
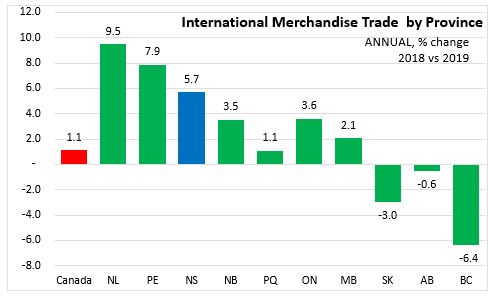
In 2019, Newfoundland and Labrador reported the highest increase (9.5%), while British Columbia reported the highest decline (6.4%) in merchandise trade exports over 2018. Nova Scotia reported a 5.7% gain in merchandise trade exports. Canada reported a 1.1% gain in merchandise trade exports over 2018.
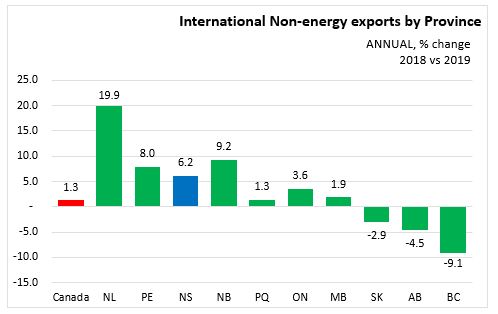
Excluding energy exports, Newfoundland and Labrador reported the highest increase (19.9%) while British Columbia reported the highest decline (9.1%) in Non-energy exports over 2018. Nova Scotia reported a 6.2% gain in Non-energy exports. Canada reported a 1.3% gain in Non-energy exports over 2018
ANNUAL EXPORTS BY INTERNATIONAL DESTINATION
Nova Scotia’s trade continues to diversify.
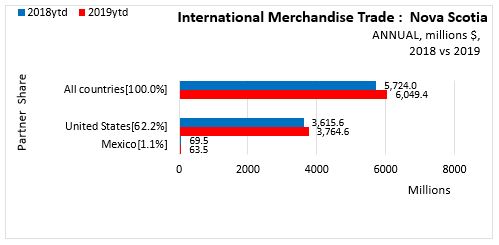
From 2018 to 2019, annual exports to the United States increased 4.1% ($148.9 million) to $3,764.6 million. Exports to Mexico decreased 8.6% (-$6.0 million) to $63.5 million.
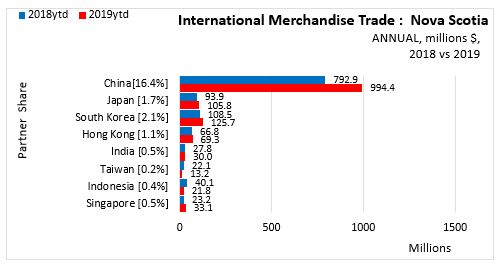
Nova Scotia's annual exports to selected Asian countries generally increased from 2018 to 2019:
- China increased 25.4% ($201.4 million) to $994.4 million.
- Japan up 12.7% ($11.9 million) to $105.8 million;
- South Korea up 15.9% ($17.2 million) to $125.7 million;
- Hong Kong up 3.8% ($2.5 million) to $69.3 million;
- India up 7.8% ($2.18 million) to $30.0 million;
- Singapore up 42.6% ($9.9 million) to $33.1 million;
- Taiwan down 40.3% (-$8.9 million) to $13.2 million;
- Indonesia down 45.7% ($18.4 million) to $21.8 million.
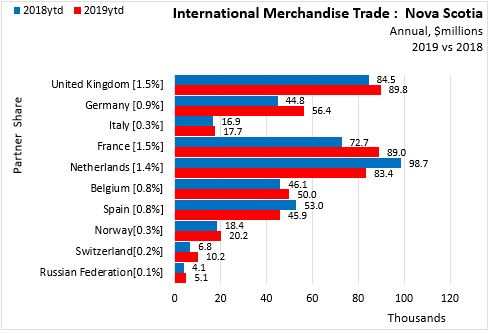
Annual export trade to selected European countries:
- United Kingdom up 6.2% ($5.2 million) to $89.8 million;
- Germany up 25.8% ($11.6 million) to $56.4 million;
- Italy up 4.6% ($0.8 million) to $17.7 million;
- France up 22.4% ($16.3 million) to $89.0 million;
- Belgium up 8.6% ($3.9 million) to $50.0 million;
- Norway up 10.2% ($1.9 million) to $20.2 million;
- Switzerland up 49.8% ($3.4 million) to $10.2 million;
- Russian Federation up 24.4% ($1.0 million) to $5.1 million.
- Netherlands down 15.5% ($15.3 million) to $83.4 million;
- Spain down 13.4% ($0.4 million) to $45.9 million.
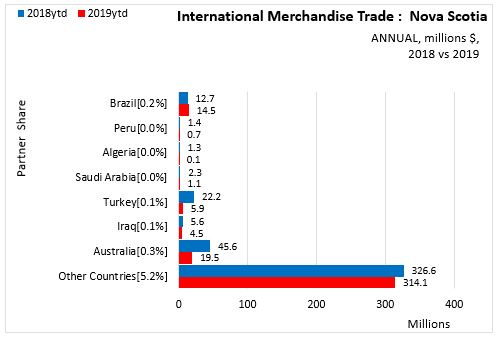
Annual export trade with other selected countries:
- Brazil up 14.7% ($1.9 million) to $14.5 million;
- Algeria down 95.3% ($1.2 million) to $0.06 million;
- Australia down 57.3% ($26.1 million) to $19.5 million;
- Iraq down 19.2% ($1.1 million) to $4.5 million;
- Peru down 46.8% ($0.6 million) to $0.7 million;
- Saudi Arabia down 52.2% ($1.2 million) to $1.1 million;
- Turkey down 73.5% ($16.3 million) to $5.9 million;
- Other countries down 3.8% ($12.5 million) to $314.1 million.
Statistics Canada Links
12-10-0119-01 International merchandise trade: Nova Scotia sectors
12-10-0119-01 International merchandise trade: by province and commodity
12-10-0119-01 International merchandise trade: by province and energy commodity
12-10-0119-01 International merchandise trade: by province, commodity, trading partners
Trading partners group 1: All, US, China
Trading partners group 2: Japan et al
Trading partners group 3: UK et al
Trading partners group 4: Mexico et al