For additional information relating to this article, please contact:
November 22, 2019RETAIL TRADE, SEPTEMBER 2019 
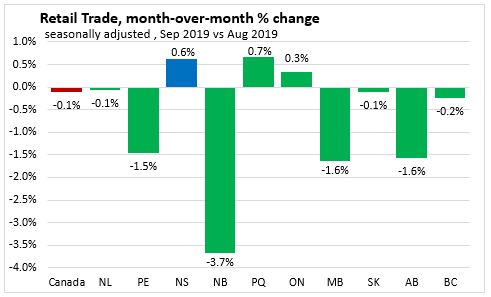
In Nova Scotia September 2019, seasonally adjusted Retail Trade increased 0.6 per cent over August 2019 to $1.4 billion. In Sep 2019 vs Sep 2018, seasonally adjusted Retail Trade increased 3.8 per cent.
Nationally, September 2019, seasonally adjusted Retail Trade decreased 0.1 per cent over August 2019 to $51.6 billion. In Sep 2019 vs Sep 2018, seasonally adjusted Retail Trade increased 1.0 per cent.
Canada and the Provinces
On a month over month basis, seasonally adjusted Retail Trade decreased 0.1 per cent nationally. Three provinces reported monthly increases in retail trade, with Quebec (0.7 per cent) reporting the largest gain. Nova Scotia reported an increase (0.6 per cent) over the previous month. New Brunswick reported the largest decline (3.7 per cent).
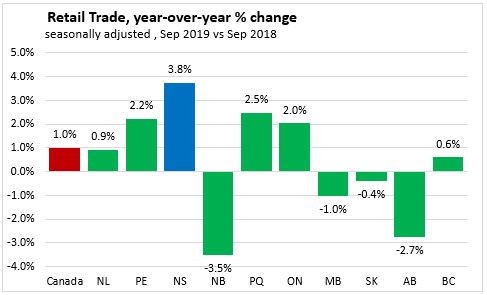
On a year over year basis, seasonally adjusted Retail Trade increased 1.0 per cent nationally. Six provinces reported year-over-year increases in retail trade, with Nova Scotia (3.8 per cent) reporting the largest gain. New Brunswick reported the largest decline (3.5 per cent).
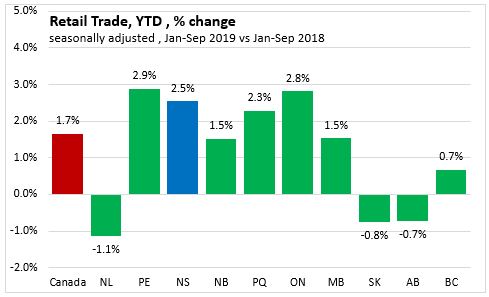
On a year to date basis, seasonally adjusted Retail Trade increased 1.7 per cent nationally. Seven provinces reported year-to-date increases in retail trade, with Prince Edward Island (2.9 per cent) reporting the largest gain. Nova Scotia reported an increase (2.5 per cent) over the same period last year.Newfoundland and Labrador reported the largest decline (1.1 per cent).
Nova Scotia Sectors
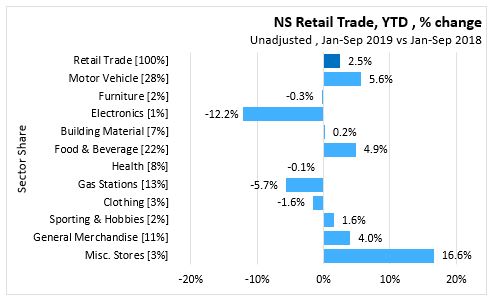
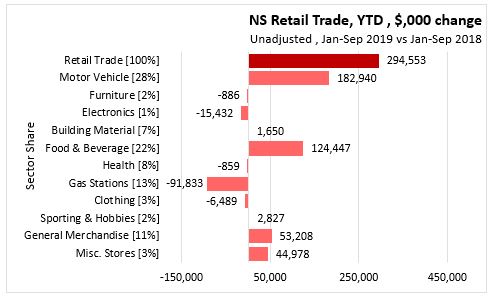
Unadjusted year-to-date (Jan-Sep 2019), Retail Trade increased 2.5 per cent ($294.6 million) over Jan-Sep 2018 to $12.1 billion.
Sector increases:
- Motor Vehicle with a 28% share of Retail Trade increased 5.6 per cent ($182.9 million).
- Building Material with a 7% share increased 0.2 per cent ($1.7 million).
- Food & Beverage with a 22% share increased 4.9 per cent ($124.4 million).
- Sporting & Hobbies with a 2% share increased 1.6 per cent ($2.8 million).
- General Merchandise with a 11% share increased 4.0 per cent ($53.2 million).
- Miscellaneous Stores with a 3% share increased 16.6 per cent ($45.0 million).
Sector declines:
- Furniture with a 2% share decreased 0.3 per cent ($0.9 million).
- Electronics with a 1% share decreased 12.2 per cent ($15.4 million).
- Health with an 8% share decreased 0.1 per cent ($0.9 million).
- Gas Stations with a 13% share decreased 5.7 per cent ($91.8 million).
- Clothing with a 3% share decreased 1.6 per cent ($6.5 million).
Cannabis stores
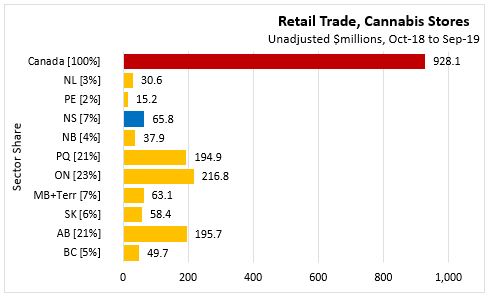
In Nova Scotia, Oct-18 to Sep-19, on a period-to-date basis, unadjusted retail cannabis store sales reached $65.8 million. This represents a 7.1% share of the Canadian market.
In Canada, Oct-18 to Sep-19, on a period-to-date basis, unadjusted retail cannabis store sales reached $928.1 million.
E-Commerce
In Canada September 2019,
- on a month-over-month basis, unadjusted retail e-commerce sales increased 5.1 per cent over August 2019 to $1.9 billion, representing a 3.7% share of total retail trade.
- On a year-over-year basis, unadjusted retail e-commerce sales increased 34.6 per cent over September 2018.
- On a year-to-date basis (Jan-Sep 2019), unadjusted retail e-commerce sales increased 25.0 per cent over Jan-Sep 2018 to $15.2 billion, representing a 3.3% share of total retail trade.
TABLES & SELECTED FIELDS
Statistics Canada Citations
Table 20-10-0072-01 Retail E-commerce sales, unadjusted (x 1,000)
Table 20-10-0008-01 Retail trade sales by province and territory (x 1,000)