For additional information relating to this article, please contact:
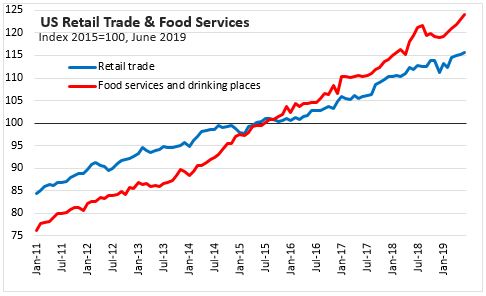
July 16, 2019US RETAIL SALES, JUNE 2019 The US Census Bureau announced today that the advance estimates of U.S retail and food service sales for June 2019, was a seasonally adjusted, month-over-month 0.4 per cent increase ($2.2 billion) over May 2019 to $519.9 billion, and a year-over-year 3.4 per cent increase over June 2018.
Excluding food services and drinking places, retail trade sales increased 0.4 per cent over May 2019, and increased 3.3 per cent over June 2018. Food service and drinking place month-over-month receipts increased 0.9 per cent to $64.5 billion.
Year-To-Date
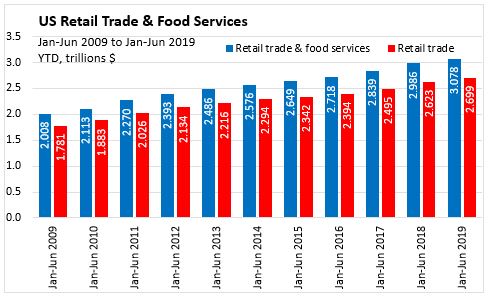
In Jan-Jun 2019, United States seasonally adjusted Retail Trade & Food Services increased 3.1 per cent over Jan-Jun 2018. Retail trade increased 2.9 per cent and
food services and drinking places sales increased 4.2 per cent.
SECTOR ANALYSIS
Sales were up in 8 of 13 retail categories with the largest percentage gains reported by Non-store Retailers, Health and Personal, and Food Services, Drinking Places. The largest percent declines were seen in Sporting and Recreation, Electronics and Furniture.
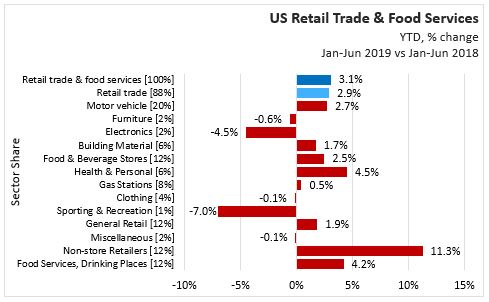
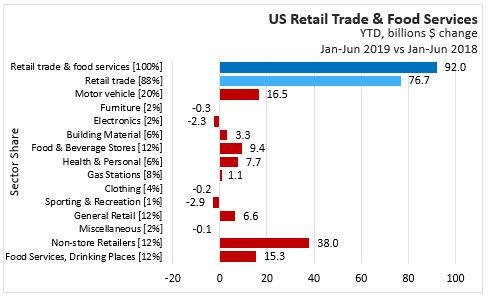
In Jan-Jun 2019 vs Jan-Jun 2018,
Retail Trade, 87.7% of total retail trade & food services, increased 2.9% ($76.7 billion) to $2,699 billion.
- Motor vehicle sector, 20.0% of total retail trade & food services, increased 2.7% ($16.5 billion).
- Furniture stores, 1.9% of total retail trade & food services, decreased 0.6% ($0.3 billion).
- Electronics stores, 1.6% of total retail trade & food services, decreased 4.5% ($2.3 billion).
- Building materials, 6.2% of total retail trade & food services, increased 1.7% ($3.3 billion).
- Food and beverage stores, 12.5% of total retail trade & food services, increased 2.5% ($9.4 billion).
- Heath, personal care stores, 5.8% of total retail trade & food services, increased 4.5% ($7.7 billion).
- Gasoline Stations, 8.2% of total retail trade & food services, increased 0.5% ($1.1 billion).
- Clothing stores, 4.4% of total retail trade & food services, decreased 0.1% ($0.2 billion).
- Sports and hobby stores, 1.3% of total retail trade & food services, decreased 7.0% ($2.9 billion).
- General merchandise stores, 11.6% of total retail trade & food services, increased 1.9% ($6.6 billion).
- Miscellaneous retail, 2.1% of total retail trade & food services, decreased 0.1% ($0.1 billion).
- Non-store retailers,12.2% of total retail trade & food services, increased 11.3% ($38.0 billion).
- Food services, drinking places, 12.3% of total retail trade & food services, increased 4.2% ($15.3 billion).
Source: US Census Bureau, Data Tables