For additional information relating to this article, please contact:
June 13, 2019CANADA NATIONAL BALANCE SHEET ACCOUNTS, Q1 2019 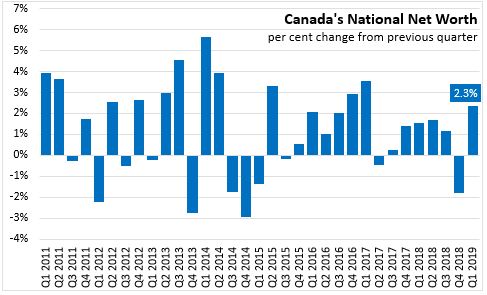
In the first quarter of 2019, Canadian national wealth rebounded with a gain of 2.3 per cent per cent (or $261.1 billion) to $11,399 billion. This more than offsets the (revised) 1.8 per cent decline observed in Q4 2018. Just as the decline in Q4 2018 was associated with lower values of natural resource assets, the rebound in Q1 2019 was also largely attributable to an increase in the value of natural resource assets. Residential asset values increased by 0.4 per cent while net foreign assets expanded on higher equity prices (though this was moderated by appreciation of the Canadian dollar).
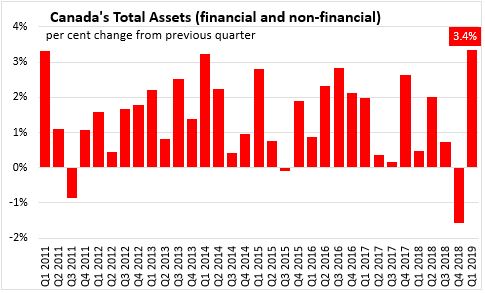
Total assets, including financial and non-financial assets increased by 3.4 per cent to $43,472 billion at the end of Q1 2019.
Household sector
In Q1 2019, Canada’s household sector net worth at market value increased 2.7 per cent to $11,114.1 billion. Financial asset values rose 4.0 per cent, with an even stronger 7.8 per cent rebound in equities and investment fund shares. Non-financial asset values were also increased by a slower 0.3 per cent on the slight increase in real estate prices.
Household borrowing edged down to $20.2 billion in Q1 2019 on rising mortgage loans. Consumer credit and non-mortgage lending were down to $7.0 billion in total while mortgage lending increased to $13.2 billion.
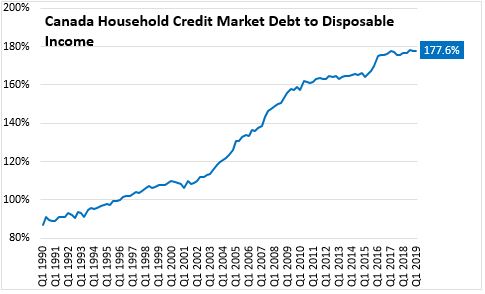
Household credit market debt as a proportion of household disposable income was stable at 177.6 per cent in Q1 2019.
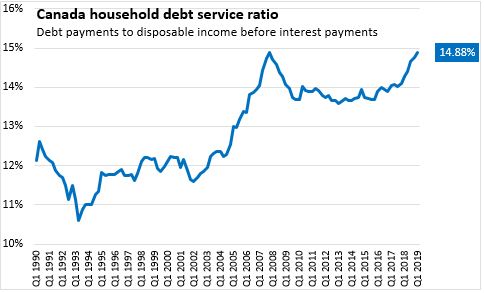
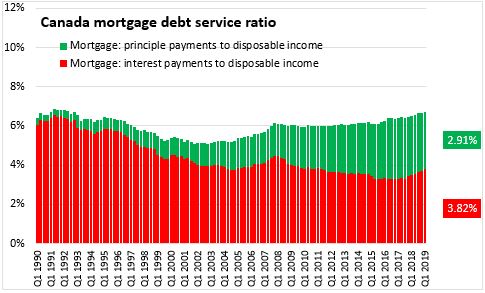
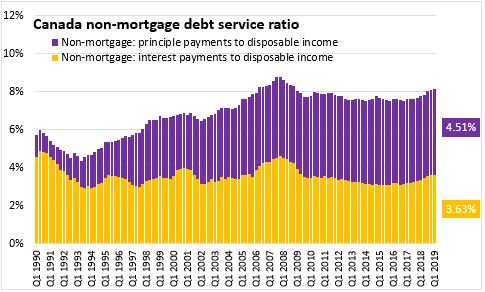
Household debt payments rose again to just under 14.9 per cent of disposable income (before interest payments), very close to the highs as observed in the fourth quarter of 2007. However, there is a markedly different composition of debt service obligations for Canadian households as obligated principal payments have risen over the last 12 years while interest payments as a share of disposable income have fallen. Nevertheless, recent interest rate rises explain most of Canada's rising debt service ratios over the last year.
Government sector
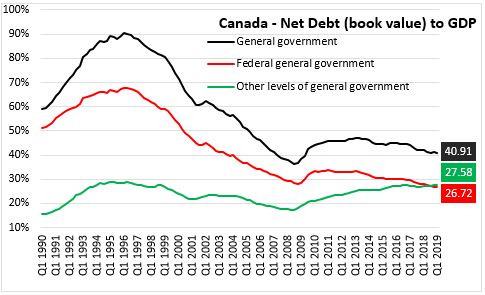
At the end of Q1 2019, general government net debt (book value) declined to 40.91 per cent of GDP. The federal government's net debt to GDP ratio continues to fall, dropping to 26.72 per cent. Net debt of other levels of government is now larger than Federal government debt at 27.58 per cent of GDP.
Corporate sector
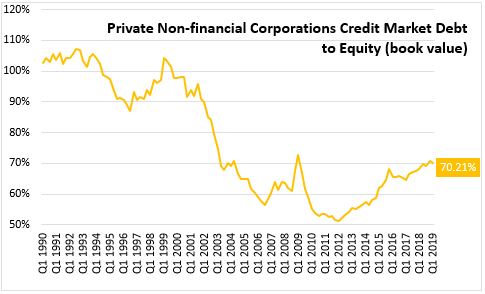
The credit market debt to equity ratio of non-financial private corporations fell to 70.21 cents of credit market debt for every dollar of equity in the Q1 2019, down from 70.66 cents (revised) in Q4 2018.
Note: Statistics Canada includes revisions to data for the first three quarters of 2018 as well as new seasonal trends. Additional revisions for selected data series reaching back to 1990 incorporate the inclusion of illegal economic activities for non-medical and medical use into the National Accounts.
Statistics Canada:
Table 11-10-0065-01 Debt service indicators of households, national balance sheet accounts
Table 36-10-0580-01 National Balance Sheet Accounts (x 1,000,000)
Table 38-10-0235-01 Financial indicators of households and non-profit institutions serving households, national balance sheet accounts
Table 38-10-0236-01 Financial indicators of corporate sector, national balance sheet accounts
Table 38-10-0237-01 Financial indicators of general government sector, national balance sheet accounts
Table 38-10-0238-01 Household sector credit market summary table, seasonally adjusted estimates