For additional information relating to this article, please contact:
October 22, 2018FOOD SERVICES AND DRINKING PLACES, AUGUST 2018 
In August 2018, Statistics Canada on a month-over-month basis, reported that food service and drinking places receipts (seasonally adjusted) in Nova Scotia decreased 0.4 per cent to $142.3 million over July 2018. Food service and drinking places receipts (seasonally adjusted) in Canada decreased 0.1 per cent to $6.1 billion over July 2018.
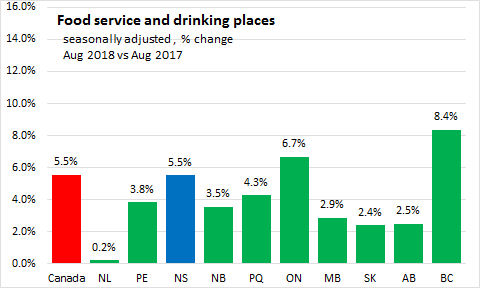
In August 2018, on a year-over-year basis, food service and drinking places receipts (seasonally adjusted) in Nova Scotia increased 5.5 percent over August 2017. Food service and drinking places receipts (seasonally adjusted) in Canada increased 5.5 per cent over August 2017.
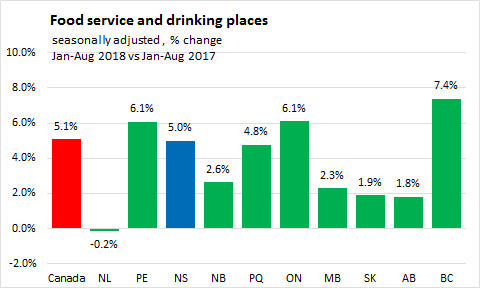
In Jan-Aug 2018, on a year-to-date basis, Nova Scotia seasonally adjusted food service and drinking places increased 5.0 per cent ($53.0 million) over Jan-Aug 2017 to $1.1 billion. Food service and drinking places receipts (seasonally adjusted) in Canada increased 5.1 per cent ($2.3 b million) over Jan-Aug 2017 to $47.5 billion.

In Canada August 2018: "Following three months of strong gains, sales in the food services and drinking places subsector edged down 0.1% to $6.1 billion in August. The decline was mainly attributable to lower spending in drinking places (-2.1%) and special food services (-0.3%), as receipts were unchanged at full-service restaurants and limited-service restaurants."
Nova Scotia Year-to-date Sales by Establishment Type
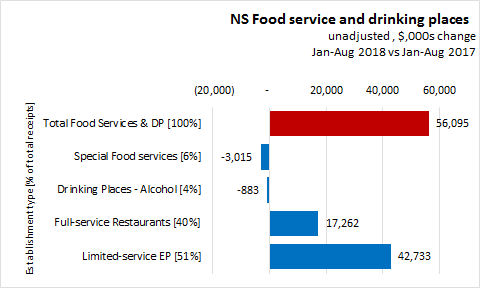
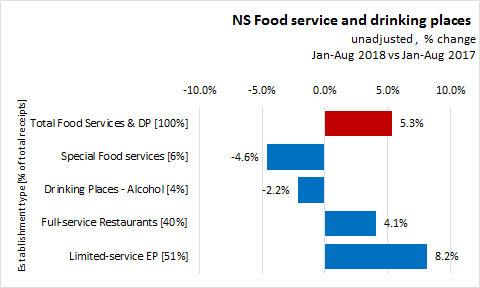
Among types of establishments,
- limited-service eating places, accounting for 51% of total food service and drinking places receipts, increased 8.2 per cent ($42.7 million) over Jan-Aug 2017 to $566 million.
- Full-service restaurants (40% of total Food service and drinking places) increased 4.1 per cent ($17.3 million) to $438 million.
- Special food services (6% of total Food service and drinking places) decreased 4.6 per cent ($3.0 million) to $62 million.
- Drinking places -alcoholic beverages (4% of total Food service and drinking places) decreased 2.2 per cent ($0.9 million) to $40 million.
BACKGROUND: FOOD SERVICES AND DRINKING PLACES
Each month, Statistics Canada reports on receipts of food services and drinking places for Canada and the Provinces. Food service and drinking place receipts are seasonally adjusted. More detailed data on receipts by type of establishment are available monthly, but these are not seasonally adjusted so only year-over-year or year-to-date analysis is appropriate.
Food service and drinking place establishments include:
- full-service restaurants, where patrons order and are served while seated and pay after eating
- limited-service eating places, where patrons order/select items at a counter and pay before eating either on premises or as take-out
- special food services, such as institutional food contractors, caterers or mobile food providers
- drinking places, primarily engaged in serving alcoholic beverages for immediate consumption (though they sometimes provide limited food services as well)
Source: Statistics Canada. Table 21-10-0019-01 Monthly survey of food services and drinking places (x 1,000)