For additional information relating to this article, please contact:
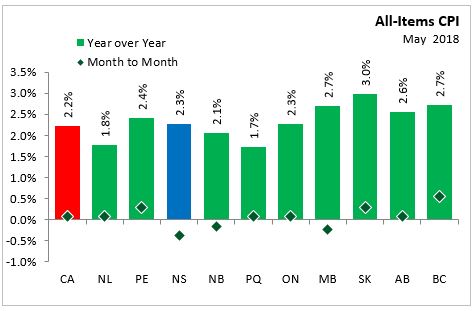
June 22, 2018ANALYSIS OF NOVA SCOTIA'S CONSUMER PRICE INDEX FOR MAY 2018 In Nova Scotia May 2018, year over year growth for the All-Items Consumer Price Index was 2.3 per cent, above the national average of 2.2 per cent. Monthly consumer prices were down 0.4 per cent in Nova Scotia and up 0.1 per cent in Canada.
Within Atlantic Canada, PEI had the highest year over year consumer price inflation (+2.4 per cent), followed by Nova Scotia, New Brunswick (+2.1%), and Newfoundland and Labrador (+1.8%).
In May 2018, all provinces experienced positive year over year inflation.
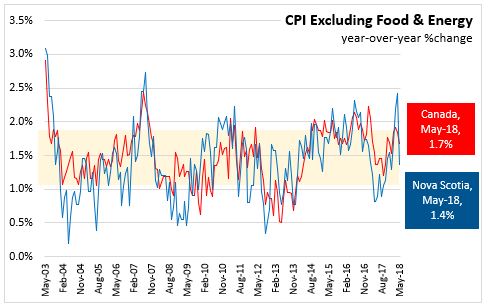
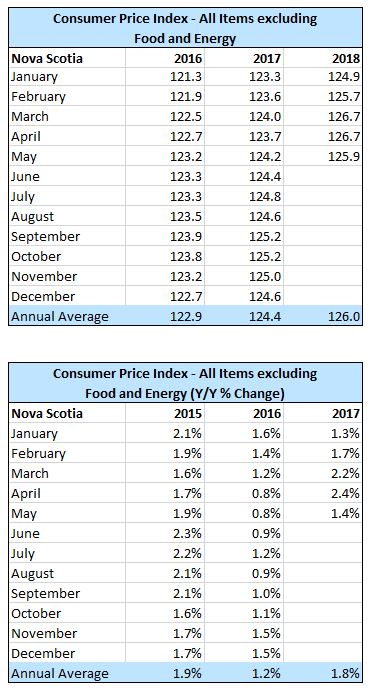
Nova Scotia's annual consumer price inflation (year over year growth in CPI) excluding food and energy rose 1.4 per cent in May, below the national rate of 1.7 per cent. Price level gains for this index were largest in BC (+2.4%) and Saskatchewan (+2.3%) and lowest in Newfoundland and Labrador (+1.0 per cent). On a monthly basis, Nova Scotia's index excluding food and energy was down 0.6 per cent.
The main contributors to the monthly (May 2018 vs. April 2018) NS CPI movement:
Non-prescribed medicines (+5.0%)
Gasoline (+5.0%)
Traveller Accommodation (-13.8%)
Fresh or frozen pork (-14.8%)
The main contributors to the annual (May 2018 vs. May 2017) NS CPI movement:
Gasoline (+21.5%)
Fuel oil and other fuels (+14.8%)
Fresh fruit (-7.5%)
Fresh or frozen pork (-19.7%)
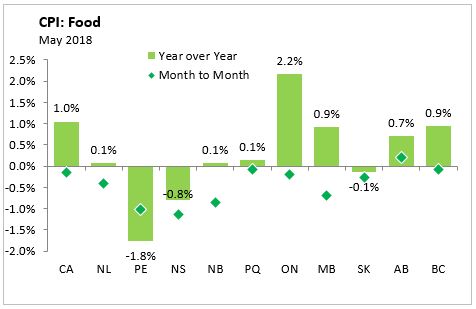
The CPI for food in Nova Scotia decreased 0.8 per cent year-over-year with a 1.1 per cent decrease month-over-month. CPI growth in food (year over year) was up in seven provinces. Nationally, annual food prices increased 1.0 per cent.
The Nova Scotia energy index increased by 13.3 per cent compared to a year ago, upwardly influenced by gasoline and other fuels. Energy price growth was smallest in Ontario (+7.8%) on a year over year basis, and largest in Alberta (+20.6%). Nationally, the index was up 11.6 per cent.
Major Components for May 2018
The following table shows the price increases specific to Nova Scotia for the major components of the CPI this month:
Long Run Trends
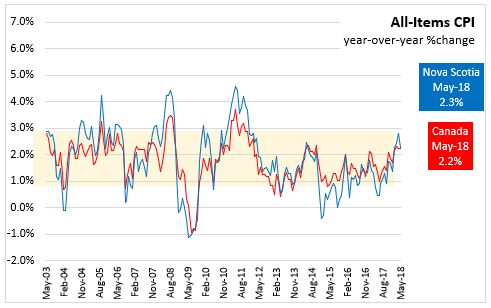
The All-Items CPI year over year inflation rate for Nova Scotia was above Canada's in May 2018. Nova Scotia's annual inflation has remained below the Canadian average since mid-2014, with the exception of only a few months. It has, however, been above the Canadian average for the past four months. While month to month movements in the indices can be different, over time they generally follow the same overall trend.
Annual inflation for the CPI excluding food and energy was lower for Nova Scotia (+1.4 per cent) than for Canada (+1.7 per cent).
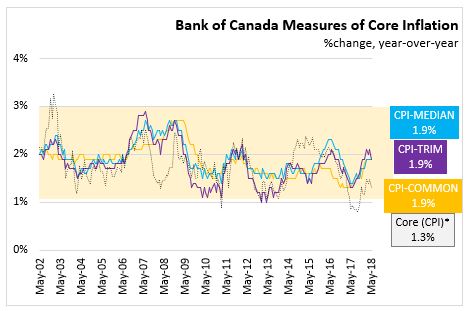
Bank of Canada's preferred measures of core inflation
Compared with May 2017, CPI-Common, CPI-Median, and CPI-Trim all rose 1.9 per cent in Canada. All-items CPI excluding eight of the most volatile components as defined by the Bank of Canada and excluding the effect of changes in indirect taxes (formerly referred to as CPIX) rose 1.3 per cent year over year in May 2018.
Appendix Tables and Charts

Source: Statistics Canada CANSIM Tables 326-0020 , 326-0023