For additional information relating to this article, please contact:
May 25, 2018FOOD SERVICES AND DRINKING PLACES, MARCH 2018 Month-over-Month
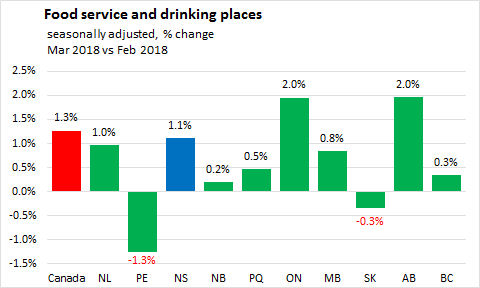
In March 2018, Nova Scotia food service and drinking places receipts (index 2015=100) increased 1.3 points to 116.0 over February 2018.Canada food service and drinking places receipts (index 2015=100) increased 1.5 points to 118.1 over February 2018.
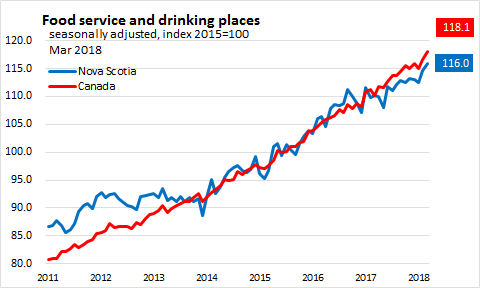
In March 2018, Statistics Canada reported that food service and drinking places receipts (seasonally adjusted) in Nova Scotia increased 1.1 per cent to $139.4 million over February 2018. Food service and drinking places receipts (seasonally adjusted) in Canada increased 1.3 per cent to $6.0 billion over February 2018.
Year-over-Year
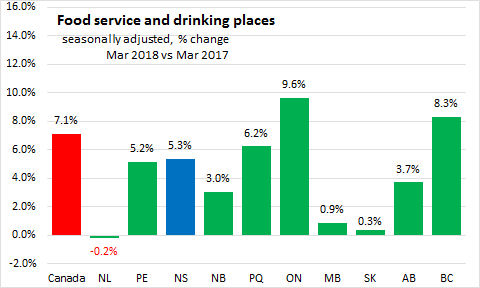
In March 2018, on a year-over-year basis, food service and drinking places receipts (seasonally adjusted) in Nova Scotia increased 5.3 per cent over March 2017. Food service and drinking places receipts (seasonally adjusted) in Canada increased 7.1 per cent over March 2017.
Year-to-Date (Jan-Mar 2018 vs. Jan-Mar 2017)
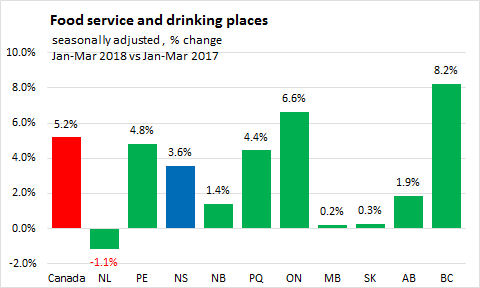
In Jan-Mar 2018, Nova Scotia seasonally adjusted food service and drinking places increased 3.6 per cent ($14.2 million) over Jan-Mar 2017 to $412.5 million. Food service and drinking places receipts (seasonally adjusted ) in Canada increased 5.2 per cent ($872.2 million) over Jan-Mar 2017 to $17.7 billion.
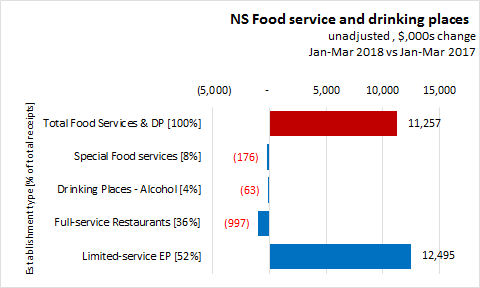
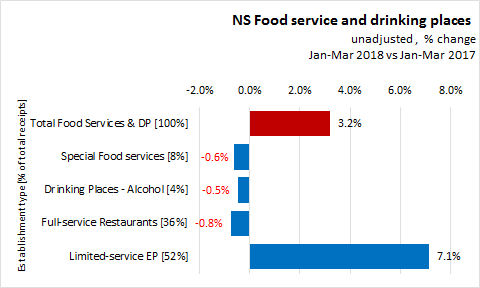
Nova Scotia YTD By Sector
Among types of establishments, limited-service eating places, accounting for 52% of total food service and drinking places receipts, increased 7.1 per cent ($12.5 million) over Jan-Mar 2017 to $188 million.
- Full-service restaurants (36% of total Food service and drinking places) decreased 0.8 per cent ($1.0 million) to $131 million.
- Special food services (8% of total Food service and drinking places) decreased 0.6 per cent ($0.2 million) to $28 million.
- Drinking places -alcoholic beverages 4% of total Food service and drinking places) decreased 0.5 per cent ($0.1 million) to $13 million.
BACKGROUND: FOOD SERVICES AND DRINKING PLACES
Each month, Statistics Canada reports on receipts of food services and drinking places for Canada and the Provinces. Food service and drinking place receipts are seasonally adjusted. More detailed data on receipts by type of establishment are available monthly, but these are not seasonally adjusted so only year-over-year or year-to-date analysis is appropriate.
Food service and drinking place establishments include:
- full-service restaurantswhere patrons order and are served while seated and pay after eating
- limited-service restaurantswhere patrons order/select items at a counter and pay before eating either on premises or as take-out
- special food services, such as institutional food contractors, caterers or mobile food providers
- drinking placesprimarily engaged in serving alcoholic beverages for immediate consumption (though they sometimes provide limited food services as well)
Source: Statistics Canada, CANSIM table 355-0006