For additional information relating to this article, please contact:
March 07, 2018NOVA SCOTIA - INTERNATIONAL MERCHANDISE TRADE JANUARY 2018 CUSTOMS BASIS
Unadjusted
Year-to-Date (January 2018 vs. January 2017)- All merchandise
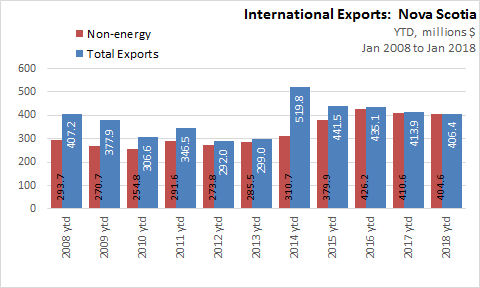
In January 2018, Nova Scotia merchandise trade exports decreased $7.5 million to $406.4 billion over January 2017.
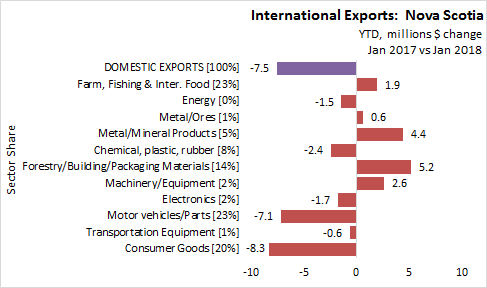
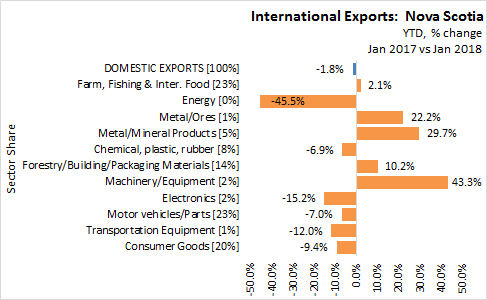
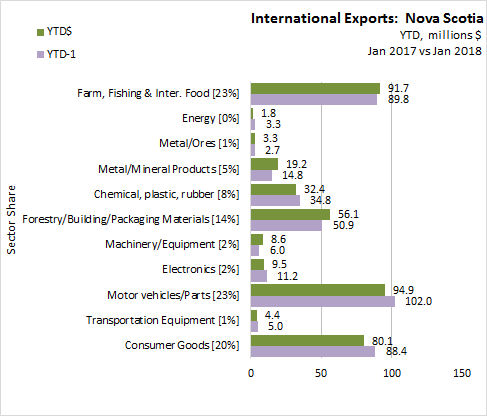
YTD - By Sector
In Nova Scotia for January 2018, merchandise exports declined 1.8 per cent or $7.5 million compared to the same month in 2017. The largest dollar value increase were in forestry (+$5.2 million), metal/mineral products (+$4.4 million), and machinery products (+$2.6 million). Energy products declined $1.5 million compared to the same period in 2017.
On a year-to-date basis, exports values increased in:
- Forestry products and building and packaging materials by 10.2% ($5.2 million) to $56.1 million
- Metal and non-metallic mineral products by 29.7% ($4.4 million) to $19.2 million
- Industrial machinery, equipment and parts by 43.3% (+$2.6 million) to $8.6 million,
- Farm, fishing and intermediate food products by 2.1% (+$1.9 million) to $91.7 million.
- Metal/Ores by 22.2% (+$0.6 million) to $3.3 million,
On a year-to-date basis, exports values decreased in:
- Energy products by 45.5% (-$1.5 million) to $1.8 million,
- Basic and industrial chemical, plastic and rubber products by 6.9% (-$2.4 million) to $32.4 million
- Electronic and electrical equipment and parts by 15.2% (-$1.7 million) to $9.5 million,
- Motor vehicles and parts by 7.0% (-$7.1 million) to $94.9 million,
- Aircraft and other transportation equipment and parts by 12.0% (-$0.6 million) to $4.4 million.
- Consumer goods by 9.4% (-$8.3 million) to $80.1 million
YTD by Province
In January 2018, Alberta reported the highest increase (+18.5%) in merchandise trade exports over January 2017. Nova Scotia reported a decline (-1.8%) in merchandise trade exports. The Canadian average was a 2.4% increase in merchandise trade exports over January 2017.

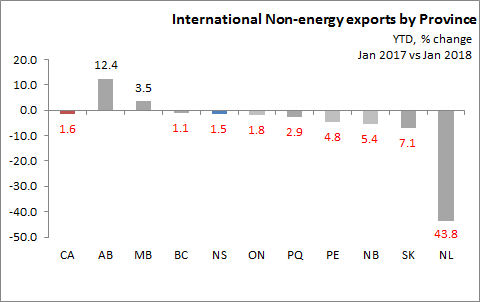
In January 2018, Alberta reported the highest increase (+12.4%) in non-energy merchandise trade exports over January 2017. Nova Scotia reported a decrease (-1.5%) in non-energy merchandise trade exports. The Canadian average was a 1.6% decrease in non-energy merchandise trade exports over January 2017.
Canada / Provinces Trade with the US and Excluding the US
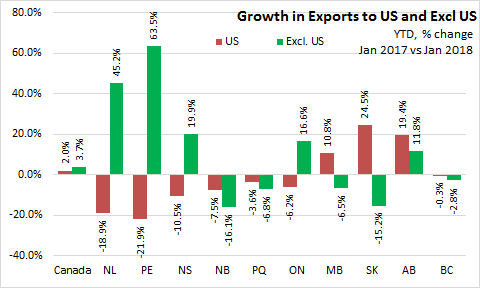
In Canada January 2018, export trade with the United States declined in seven provinces (Nova Scotia trade was down 10.5%; Newfoundland and Labrador down 18.9%; Prince Edward Island down 21.9%; New Brunswick down 7.5%; Quebec down 3.6%; Ontario down 6.2%; and British Columbia down 0.3%), over January 2017. Only the Praire provinces reported positive export growth with the United States. In Canada export growth to the United States increased 2.0%, over January 2017.
In Canada January 2018, global export trade excluding the United States was down in five provinces (New Brunswick -16.1%; Quebec -6.8%; Manitoba - 6.5%; Saskatchewan - 15.2%; British Columbia - 2.8%). In Nova Scotia merchandise trade exports excluding the United States increased 19.9% over January 2017. In Canada January 2018, non-US exports trade increased 3.7% over January 2017.
SOURCES
CANSIM tables 228-0058 to 228-0068 , and 228-0080
Publications: List of related Statistics Canada publications
Statistics Canada Daily related to this article.
Canadian international merchandise trade database.
Industry Canada Trade database.