For additional information relating to this article, please contact:
February 16, 2018MANUFACTURING SHIPMENTS, DECEMBER and ANNUAL 2017 DECEMBER
Nova Scotia
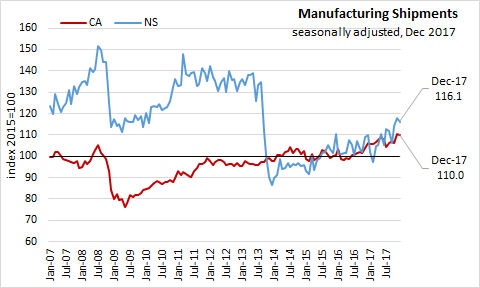
Nova Scotia’s seasonally adjusted manufacturing shipments decreased 1.3% in December 2017 to $748 million, and increased 5.6% over December 2016. The manufacturing shipments index (2015=100), declined 1.6 points to 116.1.
Canada
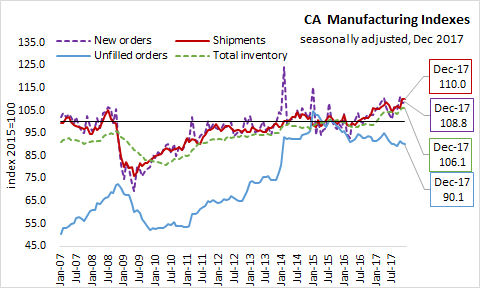
In Canada December 2017, manufacturing sales declined 0.3% over November 2017 to $55.5 billion, and increased 3.7% over December 2016. Compared to November 2017, overall sales decreased in 11 of 21 industries as durable goods increased 0.7% and non-durable goods decreased 1.3%.
Manufacturing sales declines were led by a 4.1% decline to $5.7 billion in petroleum and coal industry. Food industry was down 2.6% to $8.5 billion, as were primary metals (-2.0%) and fabricated metal products (-2.3%).
Declining sales were partially offset by increases in motor vehicle (+2.6%), machinery (+3.0%), computer and electronic products (+7.4%) and aerospace products and parts (+4.2%) industries.
Inventory levels increased 0.1% in December 2017 to $75.3 billion. The Inventory to sales ratio increased from 1.35 to 1.36. Unfilled orders were decreased 0.7% to $86.0 billion, and new orders increased 0.3% to $54.9 billion over November 2017.
Provinces
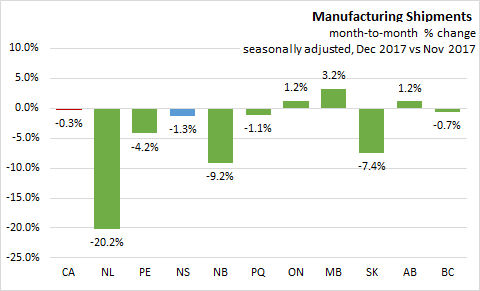
Manufacturing sales were down in seven provinces in December 2017. Newfoundland had the largest month-over-month seasonally adjusted decline at 20.2%.
In December, Manitoba led the way with 3.2% growth over November 2017. Nova Scotia ranked 6th at -1.3%. The Canadian average was -0.3%.
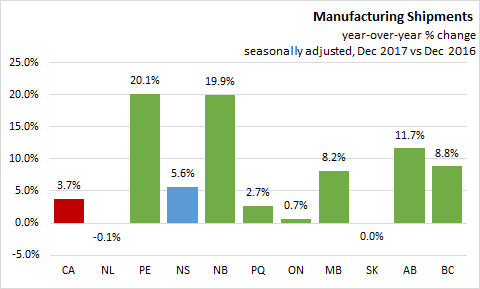
On a year-over-year basis (seasonally adjusted), manufacturing shipments are up 3.7% in Canada, with eight provinces recording positive year-over-year growth.Prince Edward Island (+20.1%) reported the fastest growth. Nova Scotia ranked 6th with manufacturing shipments increasing 5.6% over December 2016.
ANNUAL
Nova Scotia
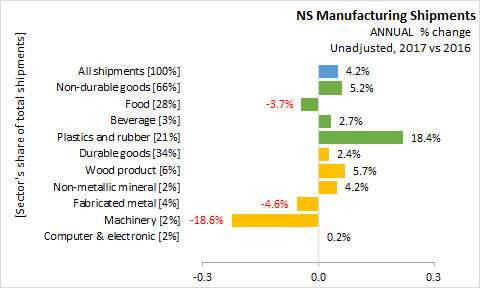
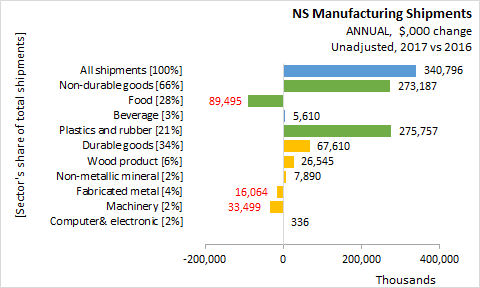
In 2017, unadjusted All shipments increased 4.2% ($340.8 million) over 2016:
Non-durable goods shipments account for 66% of Manufacturing Shipments and increased 5.2% ($273.2 million)
- Food with a 28% share decreased -3.7% ($-89.5 million)
- Beverage with a 3% share increased 2.7% ($5.6 million)
- Plastics and rubber with a 21% share increased 18.4% ($275.8 million)
Durable goods shipments account for 34% of Manufacturing Shipments and increased 2.4% ($67.6 million)
- Wood product with a 6% share increased 5.7% ($26.5 million)
- Non-metallic mineral with a 2% share increased 4.2% ($7.9 million)
- Fabricated metal with a 4% share decreased -4.6% ($-16.1 million)
- Machinery with a 2% share decreased -18.6% ($-33.5 million)
- Computer & electronic with a 2% share increased 0.2% ($0.3 million)
Provinces
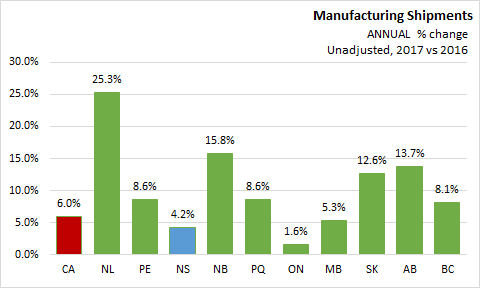
On an unadjusted annual basis, manufacturing shipments growth was positive in all provinces. Canada reported +6.0% growth in 2017 compared 2016. The largest gains were reported in Newfoundland and Labrador (+25.3%), with notable gains in New Brunswick (+15.8%), Saskatchewan (+12.6%) and Alberta (+13.7%). Nova Scotia ranked 9th with manufacturing shipments increasing 4.2%.
Statistics Canada Manufacturing Shipments December 2017 and CANSIM 304-0015 and 304-0014