For additional information relating to this article, please contact:
January 19, 2018MANUFACTURING SHIPMENTS, NOVEMBER 2017 Nova Scotia
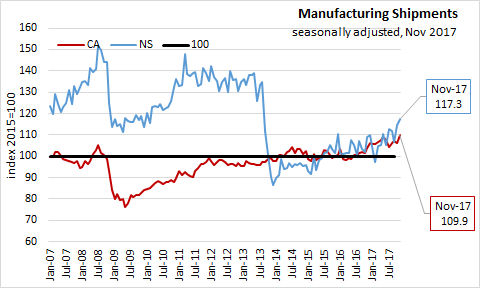
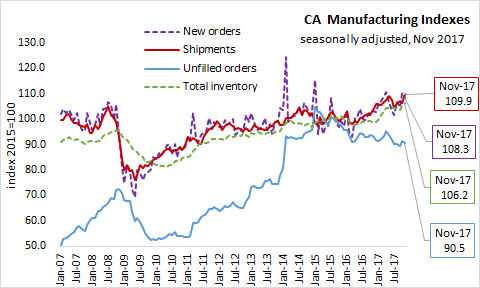
Nova Scotia’s seasonally adjusted manufacturing shipments increased 2.3% in November 2017 to $755 million, and increased 7.8% over November 2016.
For the first eleven months of the year (Jan-Nov), seasonally adjusted manufacturing shipments are 4.4% higher in 2017 than in 2016.
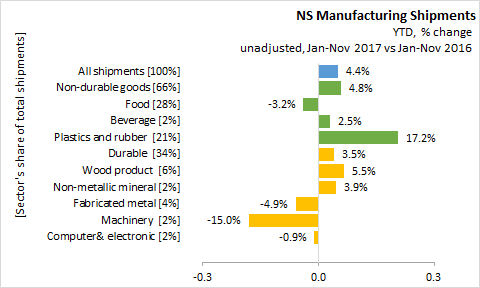
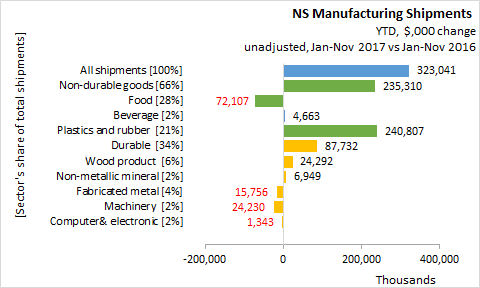
Unadjusted year-to-date (Jan-Nov), all shipments are up 4.4% (+$323 million):
- non-durable shipments account for 66% of manufacturing shipments in 2017 and increased 4.8% over the same period last year.
- Plastic and rubber shipments, with a 21% share, are up 17.2%,
- Beverages and tobacco, with a 2% share, are up 2.5% and
- Food manufacturing, with a 28% share, are down 3.2% over the same period last year.
- durable goods manufacturing accounts for 34% of shipments in 2017, increased 3.5%.
- Wood products, with a 6% share, are up 5.5%,
- Non-metallic mineral products, with a 2% share, are up 3.9%,
- Fabricated metal products, with a 4% share, are down 4.9%,
- Machinery products, with a 2% share, are down 15.0%, and
- Computer and electronics, with a 2% share, are down 0.9%, over the same period last year.
Canada
Canada manufacturing sales rose 3.4% to $55.5 billion in November 2017, and are up 6.0% above last year. Compared to October 2017, overall sales increased in 12 of 21 industries as durable goods increased 3.4% and non-durable goods increased 3.4%.
The sales increase was led by increases of 9.1% to $10.6 billion in the transportation equipment industry. Sales were also up in the petroleum and coal product industry (+6.1% to $6.0 billion) and Chemical industry (+5.9% to $4.4 billion).
Increased sales were partially offset by decreases in computer and electronic products (-2.5%) and machinery industry (-0.6%).
Inventory levels increased 0.9% in November 2017 to $75.4 billion. The Inventory to sales ratio decreased from 1.39 to 1.36. Unfilled orders were decreased 0.9% to $86.4 billion, and new orders decreased 1.8% to $54.7 billion over October 2017.
Provinces
Manufacturing sales were up in nine provinces in November 2017. Prince Edward Island had the largest month-over-month seasonally adjusted growth at 23.2%. Nova Scotia ranked 6th at 2.3%. The Canadian average was 3.4%.

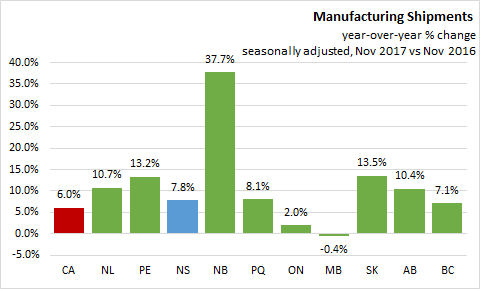
On a year-over-year basis (seasonally adjusted), manufacturing shipments are up 6.0% in Canada, with nine provinces recording positive year-over-year growth. New Brunswick (+37.7%) reported the fastest growth. Nova Scotia ranked 7th with manufacturing shipments increasing 7.8% over November 2016.
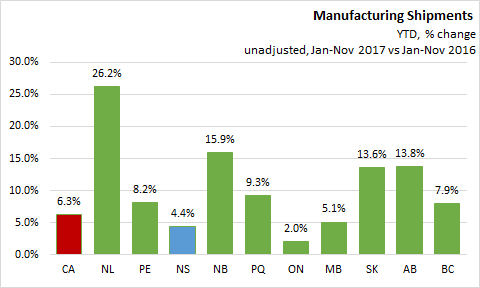
On an unadjusted year-to-date basis, manufacturing shipments growth was positive in all provinces. Canada reported +6.3% growth compared with the first eleven months of 2016. The largest gains were reported in Newfoundland and Labrador (+26.2%), with notable gains in New Brunswick (+15.9%), Saskatchewan (+13.6%) and Alberta (+13.8%). Nova Scotia ranked 9th with manufacturing shipments increasing 4.4%.
Statistics Canada Manufacturing Shipments December 2017 and CANSIM 304-0015 and 304-0014