For additional information relating to this article, please contact:
September 09, 2016LABOUR MARKET TRENDS - AUGUST 2016 TRENDS AUGUST 2016
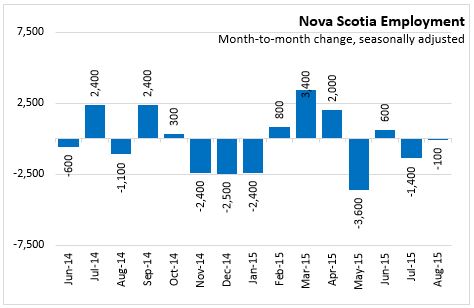
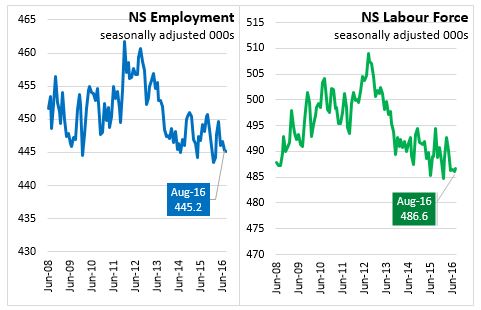
Nova Scotia's seasonally adjusted employment decreased by 100 to 445,200 in August 2016. This statistically insignificant decline follows on a decline of 1,400 in July. Employment in the province has declined in three of the last four months.
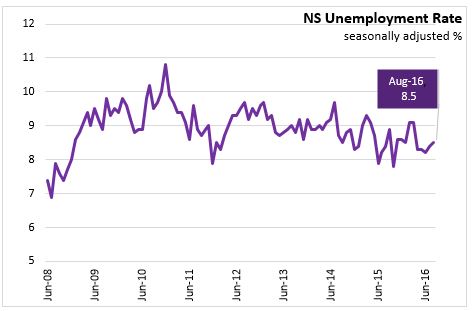
Compared to July, the labour force increased by 500 to 486,600 in August. With labour demand falling and the labour supply rising, the net result was an increase of 0.1 percentage points in the seasonally adjusted unemployment rate to 8.5 per cent in August. With an increase in the labour supply and an increase in the population (+0.1%) the participation rate was unchanged at 61.6 per cent for the month. The employment rate was unchanged at 56.4 per cent in the month.
In August, the decrease in employment reflects an increase of 3,900 full-time jobs and a decrease of 4,000 part-time jobs. Shifts in the number of hours worked can result in swings between the number of full-time and part-time jobs.
Compared with August 2015, the labour force has decreased by 2,500 (-0.5 percent) while employment decreased by 2,900 (-0.6 per cent). Full-time employment levels in August are down 5,800 from a year ago, and part-time is up 2,900 for same month in 2015. Overall, with labour demand decreasing at faster pace than the labour supply, the end result was a 0.1 percentage point increase in seasonally adjusted unemployment rate to 8.5 per cent.
Year-to-Date (Jan-Aug. 2016 vs Jan-Aug. 2015)
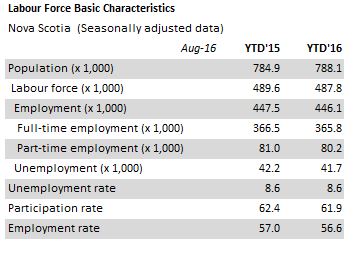
For the first eight months of 2016 compared to the first eight months of 2015, there was a decrease of 1,400 (-0.3 per cent) in the average employment level. Average full time employment was down 600 and there were 800 fewer part time jobs. The labour force was down 1,900 (-0.4 per cent) for the first eight months of 2016. With labour supply falling at a similar rate as labour demand, the net result was an unchanged unemployment rate of 8.6 per cent between the two periods. The labour force participation rate dropped 0.5 percentage points to 61.9 per cent. The employment rate also fell by 0.4 percentage points to 56.6 per cent.
AGE COHORTS (Jan-Aug 2016 vs. Jan-Aug 2015)
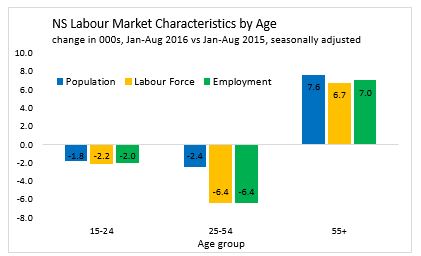
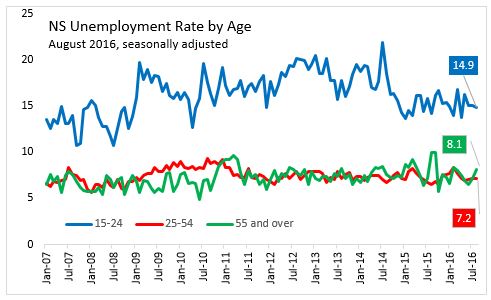
The labour force survey population estimate of 15-24 year olds declined by 1,800 between Jan-Aug. 2016 and Jan-Aug 2015. The age group saw a decline of 2,200 in the labour force and 2,000 in employment during this period as the number of unemployed declined by 100. The unemployment rate increased 0.3 percentage points to 15.1 per cent for the Jan-Aug. 2016 period.
Among Nova Scotians aged 25 to 54, employment and the labour force both declined 6,400 between the Jan-Aug. 2016 and Jan-Aug 2015 period. The results was an increase in the unemployment rate of 0.1 percentage point to 7.4 per cent. The participation rate in the labour force fell 1.2 percentage points to 85.3 per cent for this age group.
Among Nova Scotian aged 55 and over, the population, labour force and employment have all increased over the first eight months of 2016 compared to the same eight months of the previous year. Employment increased by 7,000 faster than the rise in the labour force size (6,700), causing a decline in unemployment of 300 and a fall in the unemployment rate of 0.8 percentage points to 7.4 per cent.
SECTORS (Jan-Aug 2016 vs. Jan-Aug 2015)
Comparing the first eight months of 2016 to the first eight months of 2015, employment in goods-producing sectors decreased by 1,300 jobs. Employment declines in construction, agriculture, forestry/fishing and utilities more than offset the gain of 1,500 net jobs in the manufacturing sector. There was a net loss in employment of 100 in service-producing sectors. Employment gains in transportation, health, education, public administration, financial services and other services were not enough to override the job losses in wholesale/retail trade, business/support services (includes call centres), and information, culture and accommodation/food services.

Regions (YTD 3 month moving average, unadjusted)
For the period of Jan-Aug. 2016 compared to Jan-Aug 2015, Halifax and Annapolis Valley region had employment rise faster than labour force growth and thus lower unemployment rates. In Cape Breton and the Southern region unemployment rose as labour demand declined faster than labour supply.
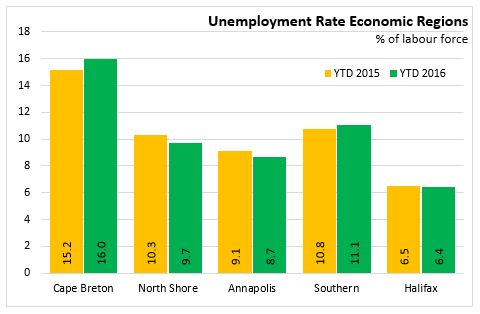
The Cape Breton region reported a decrease in employment of 4,000 for the first eight months of 2016 over the first eight months of 2015. The labour force dropped by 4,300 for the same period. With employment decreasing at a faster pace than the labour force, the end result was a 0.8 percentage point increase in the unemployment rate to 16.0 per cent.
For the North Shore region, employment decreased 100 for the first eight months of 2016 over the eight months of 2015. Labour supply decreased by 500 for the same period. The larger decrease in labour supply caused a 0.6 percentage point decline in the unemployment rate to 9.7 per cent.
The Annapolis region experienced an increase of 2,100 in employment while the labour force had the same increase of 2,100 for the first eight months of 2016 over the same period in 2015. The net result was a decline of 0.4 percentage points in the average unemployment rate to 8.7 per cent as a smaller share of labour force is unemployed.
The Southern region saw employment fall by 1,500 and the labour force had a drop of 1,500 for the first eight months of 2016 over the first eight months of 2015. With the labour supply falling at a slightly slower pace, the unemployment rate increased 0.3 percentage points to 11.1 per cent.
For the first eight months of 2016 compared to the first eight months of 2015, Halifax (HRM) experienced an increase in employment (1,800) along with an increase of 1,600 in the labour supply. With labour market demands increasing at a slightly faster pace than labour supply, the net impact was 0.1 percentage point decrease in the unemployment rate to 6.4 per cent.
Provincial Comparisons
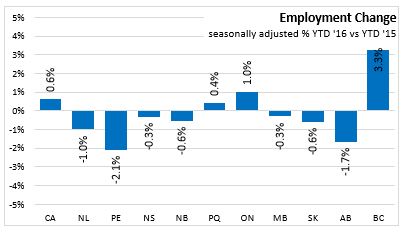
Employment has increased 0.6 per cent in Canada comparing the first eight months of 2016 with the first eight months of 2015. Over this period growth has only occurred in three provinces: British Columbia (+3.3%), Ontario (+1.0%) and Quebec (+0.4%). The largest declines have been in Prince Edward Island (-2.1%), Alberta (-1.7%), and Newfoundland and Labrador (-1.0%).
The Nova Scotia unemployment rate was 8.5 per cent in August 2016. In August of last year, the Nova Scotia unemployment rate was 8.4 per cent. Six provinces have higher unemployment rates compared to last year including Newfoundland, Prince Edward Island, Nova Scotia, Manitoba, Saskatchewan and Alberta. Quebec and British Columbia had the largest declines in their unemployment rates at 0.9 and 0.7 percentage points respectively. The lowest unemployment rate among the provinces in August 2016 was in British Columbia at 5.5 per cent.

National Comparisons: Cities
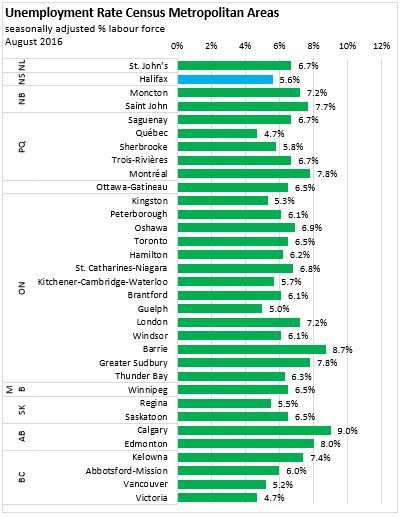
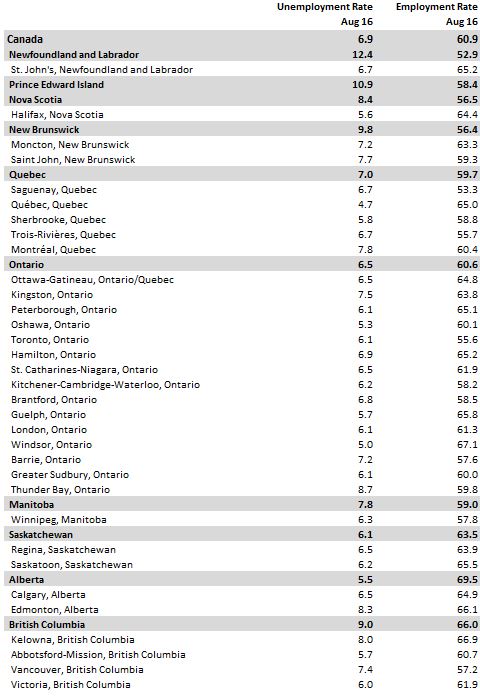
The seasonally adjusted unemployment rate for the Halifax Census Metropolitan Area was 5.6% per cent. Quebec and Victoria(both 4.7%) had the lowest unemployment rate in Canada this month.
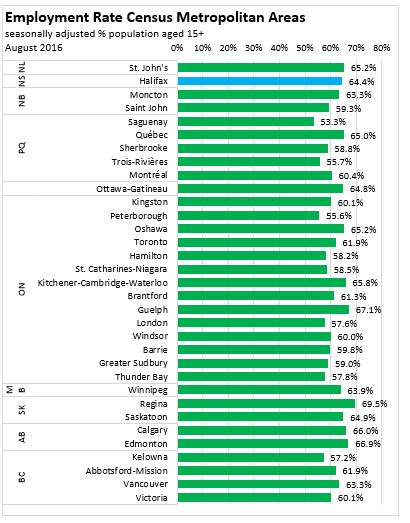
The seasonally adjusted employment rate for the Halifax Census Metropolitan Area was down 0.2 percentage points from the previous month at 64.4 per cent in August 2016.
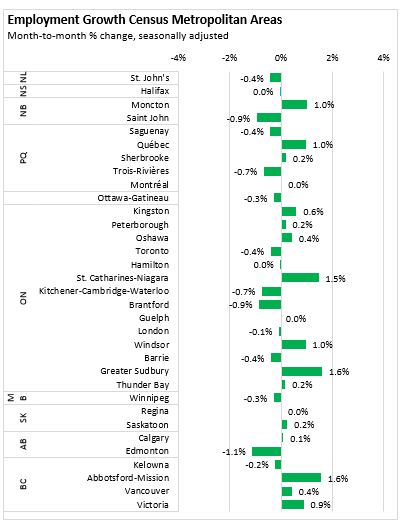
Employment in the Halifax CMA was unchanged in August 2016 compared to the previous month. The largest monthly gain among CMAs was in Abbotsford-Mission BC, and Greater Sudbury where employment rose by 1.6 per cent over the previous month.
Note: Seasonally adjusted, 3 month average.