For additional information relating to this article, please contact:
July 12, 2016CORRECTION: CANADIAN INCOME SURVEY, 2014 *CORRECTION: The previous release presented income statistics for economic families and persons not in an economic family and did not represent individual incomes. This was not noted in the previous release. The corrected release includes additional statistics for individuals 16 and over.
Statistics Canada has released further indicators of income for 2014 for Nova Scotia.
INDIVIDUAL INCOME
Individual income statistics below are for the population 16 years of age and older and exclude persons with zero income. Dollar estimates are expressed in 2014 constant dollars to factor in inflation and enable comparisons across time in real terms.
In 2014, the average income of Nova Scotians age 16 years and over (excluding those with zero income) was $39,500, about 91 per cent of the Canadian average. Average income figures can be biased by higher earners with very large incomes, so median income offers a different perspective. The median is the level of income at which half the population has higher income and half has lower. In 2014, the median income of individuals in Nova Scotia was $30,800 or 94 per cent of the national median.

Median individual after-tax income was $27,300 (excluding persons with no income), unchanged from 2013 (2014 constant dollars). The median after-tax income in Canada was $29,100, up 2.1 per cent from 2013.

INCOME OF FAMILIES AND PERSONS NOT IN AN ECONOMIC FAMILY
Income estimates below exclude persons under 15 years of age. Dollar estimates are expressed in 2014 constant dollars to factor in inflation and enable comparisons across time in real terms.
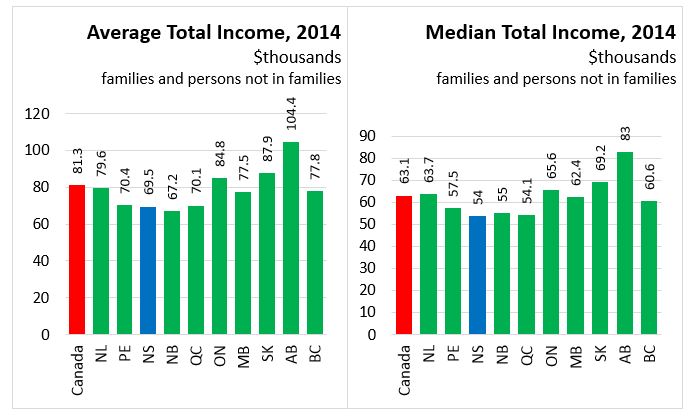
In 2014, the average total income of all Nova Scotian economic families and persons not in an economic family was was $69,500, about 85 per cent of the Canadian average. Median total income in Nova Scotian economic families and persons not in an economic family was $54,000 or 86 per cent of the national median, the lowest in Canada.
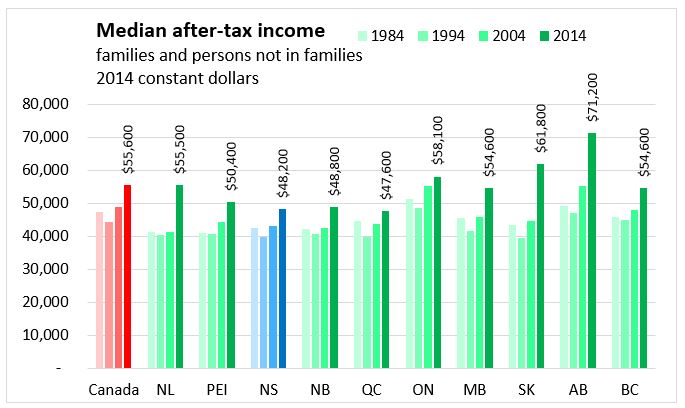
Median after-tax income in Nova Scotian economic families and persons not in an economic family was $48,200, up 0.2 per cent from 2013 (2014 constant dollars). The median after-tax income in Canada was $55,600, up 2.6 per cent from 2013.
COMPOSTION OF INCOME
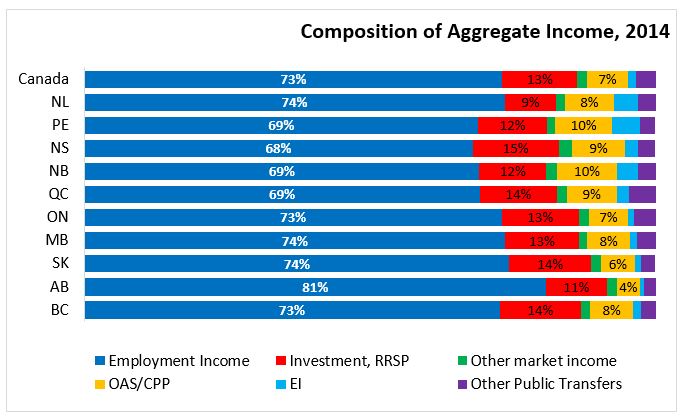
The Canadian Income Survey distinguishes between income from market sources and government transfers. In 2014, 68 per cent of the aggregate income of Nova Scotians was from employment income, the lowest in Canada.
Nova Scotia had the highest share of income from investment and retirement earnings at 15 per cent. This was likely due in part to Nova Scotia’s older population. Nova Scotia (9%) along with PEI (10%), New Brunswick (10%) and Quebec (9%), also had the highest shares of income from Old Age Security (OAS) and Canada Pension Plan (CPP).
IMPLICIT TAX RATE
The income survey also assesses income taxes paid (federal and provincial) and after tax income.
In 2014, average income tax paid by economic families and persons not in an economic family increased by 1.8 per cent in Nova Scotia compared to 2013 (constant 2014 dollars) while the average government transfers fell by 1.0 percent. In Canada, the average income tax paid increased by 3.1 per cent while the average government transfer fell by 2.0 percent.
Information on taxes and transfers also allow for a calculation of an implicit 'transfer rate" (the share of total income generated by government transfers) and an implicit tax rate (the share of total income paid in income taxes). In 2014, Nova Scotia’s implicit tax rate (17%) for economic families and persons not in an economic family exceeded Nova Scotia’s implicit transfer rate (15%). This was the case for most provinces in 2014, with the exception of PEI and New Brunswick.

INCOME DISTRIBUTION
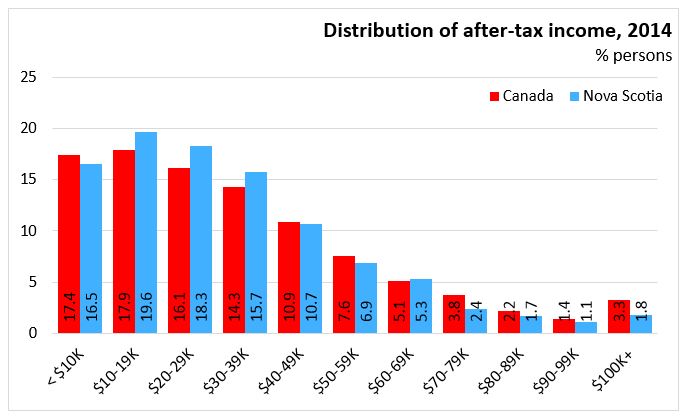
The survey also allows for comparison of income distribution. In Nova Scotia 2014, more than 50 per cent of persons in economic families and persons not in an economic families had income of $30,000 per year or less (after tax, including those with zero income) while only 1.8 per cent had incomes of $100,000 and above.
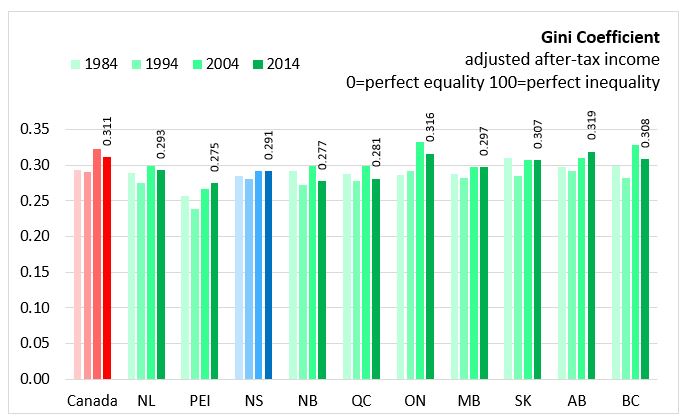
Another income distribution statistics available from the income survey is the Gini Coefficient which measures the relative degree of inequality in the distribution of income. The coefficient would register zero (minimum inequality) for a population in which each person received exactly the same adjusted household income and it would register a coefficient of one (maximum inequality) if one person received all the adjusted household income and the rest received none. Even though a single Gini coefficient value has no simple interpretation, comparisons of the level over time or between populations are very straightforward: the higher the coefficient, the higher the inequality of the distribution.
In 2014, Nova Scotia’s Gini coefficient was the fourth lowest in Canada at 0.291. This was down only slightly from ten years earlier when it was 0.292.
LOW INCOME
The income data reported by the Canadian Income Survey also allows for examination of those that are in 'low income'. There are a variety of definitions of low income, each corresponding to a threshold for household income below which all individuals would be considered in some form of low income. Each low income measure offers different insights into the nature of low income in Canada.
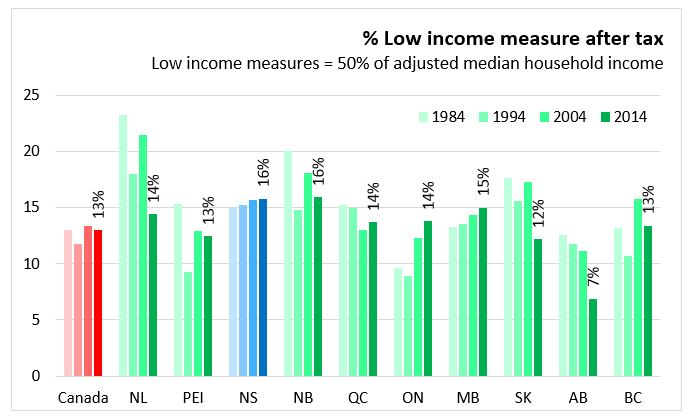
Low income measures (LIM) are most commonly used when making international comparisons. In simple terms, the LIM is a fixed percentage (50%) of the median adjusted household income, where 'adjusted' indicates that household needs (based on size) are taken into account. In 2014, 16% of Nova Scotians in economic families and persons not in an economic family were in low income, one of the highest shares in Canada.
In Nova Scotia the incidence of low income varies with family type. A family is defined as a group of two or more persons who live in the same dwelling and are related to each other by blood, marriage, common-law, adoption or a foster relationship.
Among those in families, couple families and those in elderly families (families in which the major income earner is 65 years or older) have a lower incidence of low income compared with lone-parent families and other families. Among those who are not in families, elderly males and particularly elderly females have a higher incidence of low income compared with non-elderly males and females.

This release is based on data from the Canadian Income Survey. As estimates are based on probability samples, differences between estimates are reported only where they are statistically significant at the 5% level of confidence.
As of this release, estimates are produced according to population projections based on data from the 2011 Census of Population. As a result, data from 2006 to 2013 have been revised.
The Canadian Income Survey is a replacement to the former Survey of Labour and Income Dynamics which ran from 1976 through 2011. Although the new Canadian Income Survey and the former Survey of Labour and Income Dynamics measure many of the same variables, each uses a different methodology. Comparisons of data from each survey may therefore be attributable to the different methods, rather than a true change in the characteristics of the population.
Sources: Statistics Canada, Canadian Income Survey, CANSIM 206-0011 through 206-0094