The Economics and Statistics Division maintains archives of previous publications for accountability purposes, but makes no updates to keep these documents current with the latest data revisions from Statistics Canada. As a result, information in older documents may not be accurate. Please exercise caution when referring to older documents. For the latest information and historical data, please contact the individual listed to the right.
<--- Return to Archive
For additional information relating to this article, please contact:
January 10, 2024LABOUR FORCE SURVEY: SUPPLEMENTAL ANNUAL DETAILS (2023) The Labour Force Survey asks many detailed questions about Canadians' experiences in the labour market. This report examines additional details that are available through the Labour Force Survey.
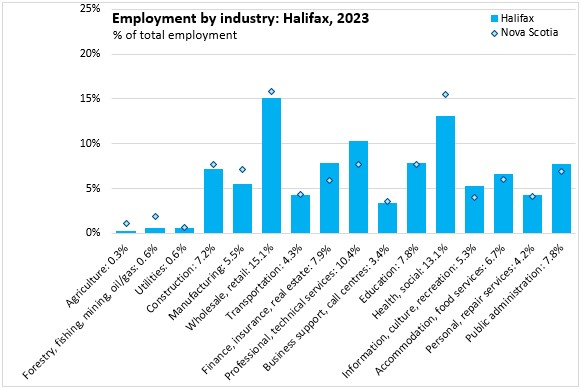
Regional employment by industry
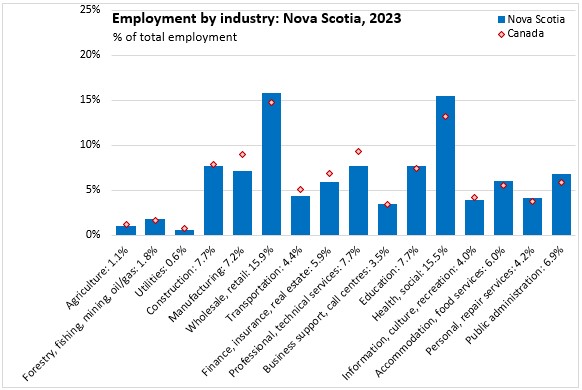
Measured as a share of total employment, Nova Scotia's employment is relatively more concentrated (compared with the national average) in wholesale/retail, health/social (including daycare) and public administration. Nova Scotia's employment is disproportionately low (compared to the national average) in manufacturing, transportation, professional/technical services and finance/insurance/real estate.
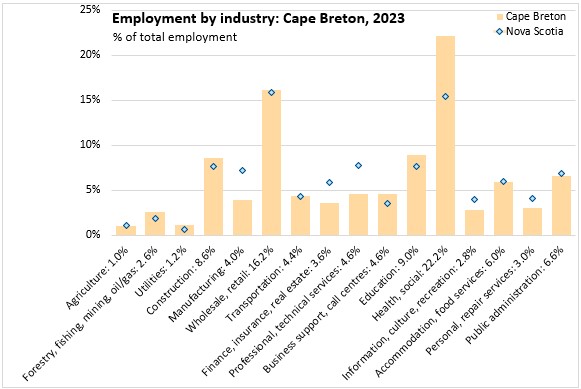
Compared against the provincial distribution of employment by industry, employment in Cape Breton is notably more concentrated in health care and social assistance (including daycare). Compared with the provincial average, Cape Breton's employment in manufacturing, finance/insurance/real estate and professional/technical services is disproportionately low.
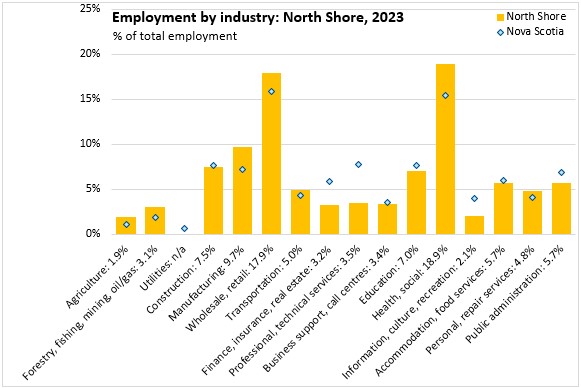
Compared against the provincial distribution of employment by industry, employment in the North Shore economic region is notably more concentrated in health/social (including daycare), wholesale/retail, agriculture, natural resources and manufacturing. Compared with the provincial average, the North Shore's employment in finance/insurance/real estate, professional/technical services and information/culture/recreation is disproportionately low.
Compared against the provincial distribution of employment by industry, employment in the Annapolis Valley is notably more concentrated in agriculture, construction and manufacturing. Compared with the provincial average, the Annapolis Valley's employment is disproportionately low in in finance/insurance/real estate, professional/technical services, information/culture/recreation and accommodation/food services.

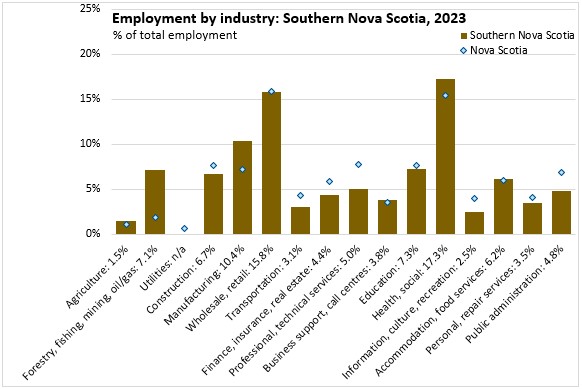
Southern Nova Scotia's employment is notably more concentrated in natural resources, manufacturing and health/social (including daycare). Southern Nova Scotia is disproportionately low compared with the provincial average for: construction, transportation, professional/technical services, finance/insurance/real estate, information/culture/recreation, personal/repair services and public administration.
In Halifax, employment by industry was notably more concentrated (compared with the provincial average) in: finance/insurance/real estate, professional/technical services, information/culture/recreation and public administration.
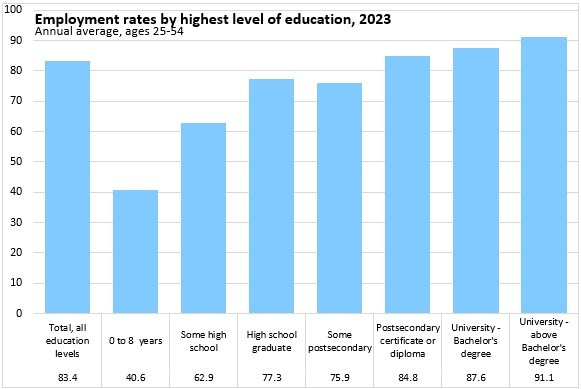
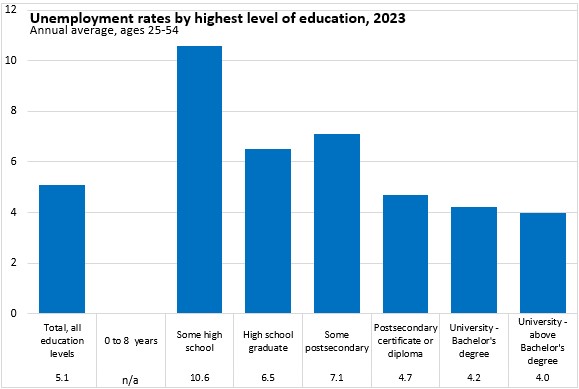
Labour market outcomes by highest level of education completed
Labour force participation rates and employment rates rise for those with higher levels of education.
The participation rate of those with 8 or fewer years of schooling (aged 25-54) was only 53.1% while it was 94.9% for those with a university degree beyond the Bachelor's level.

Employment rates in 2023 ranged from a low of 40.6% for those aged 25-54 with 8 or fewer years of schooling up to a high of 91.1% for those with a post-graduate degree.
Unemployment rates for Nova Scotians with the least amount of education were unavailable, but those with only some high school education reported a markedly higher unemployment rate in 2023 (10.6%) than those with university Bachelor's degrees (4.2%) or those with higher postsecondary degrees (4.0%).
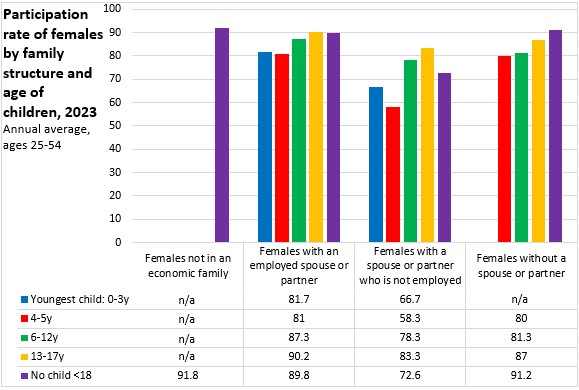
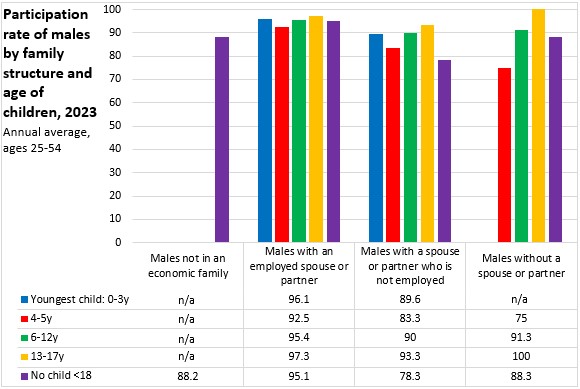
Labour force participation by family structure
Presence of children influences labour force participation rates, but so does the presence of a spouse with employment. Among women, the participation rate for those without children (ages 25-54) was 91.8%. Participation rates for women with children were lower - particularly if the woman had a spouse or common-law partner that did not have a job.
Reasons for labour market outcomes
As part of the Labour Force Survey, Statistics Canada asks respondents about their reasons for conditions such as part-time employment, losing a job or not participating at all in the labour force.
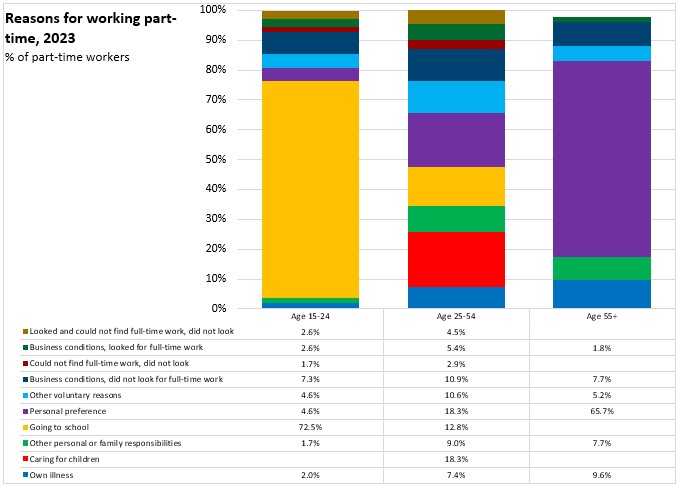
In 2023, there was an average of 88,500 part-time workers, fairly evenly distributed across three age categories: ages 15-24, ages 25-54 and ages 55+. For younger workers, going to school was by far the most common reason for working part time. For older workers, personal preference was the main reason for part time work.
Among those who either left or lost a job in 2023 (67,500 persons), the most common reason for losing a job was permanent layoff. However, for younger workers, going to school was the most common reason for losing a job in 2023 while for older workers, retirement was the most common reason for leaving a job.

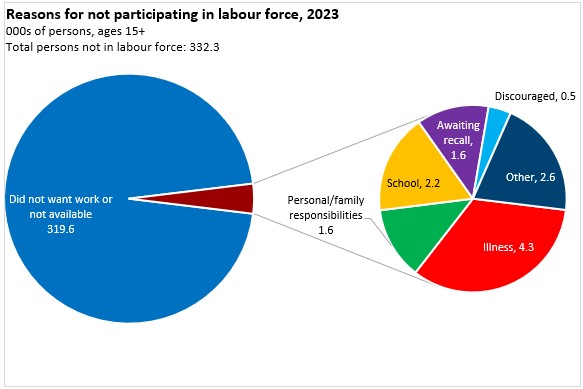
There were 332,300 persons in Nova Scotia who did not participate in the labour force in 2023. Of these, the vast majority (319,600) did not participate in the labour force because they did not want work (for reasons such as retirement) or were not available for work. Of the 12,700 persons that were not in the labour force but wanted work, illness was the most common reason for not participating. School, personal/family responsibility and waiting for recall were the next most common reasons for not participating in the labour force, despite wanting work.
Source: Statistics Canada. Table 14-10-0396-01 Labour force characteristics by family structure, annual, unadjusted for seasonality; Table 14-10-0029-01 Part-time employment by reason, annual (x 1,000); Table 14-10-0126-01 Reason for leaving job during previous year, annual (x 1,000); Table 14-10-0128-01 Reason for not looking for work, annual (x 1,000); Table 14-10-0020-01 Unemployment rate, participation rate and employment rate by educational attainment, annual; Table 14-10-0392-01 Employment by industry, annual (x 1,000)
<--- Return to Archive