The Economics and Statistics Division maintains archives of previous publications for accountability purposes, but makes no updates to keep these documents current with the latest data revisions from Statistics Canada. As a result, information in older documents may not be accurate. Please exercise caution when referring to older documents. For the latest information and historical data, please contact the individual listed to the right.
<--- Return to Archive
For additional information relating to this article, please contact:
November 30, 2023CANADIAN ECONOMIC ACCOUNTS Q3 2023 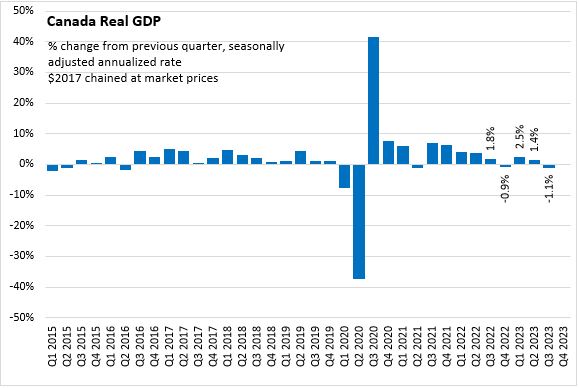
Canada’s Real Gross Domestic Product (GDP) declined 1.1% (all figures seasonally adjusted at annual rates) in the third quarter of 2023, following a 1.4% gain in Q2 2023. Compared to pre-pandemic Q4 2019, the Canadian economy was 4.2% larger in Q3 2023.
Statistics Canada notes that the slowdown in GDP growth was attributed to a decline in international exports and slower inventory accumulation. These declines were partially offset by increases in government spending and housing investment. Household expenditure was virtually unchanged at 0.1% for the quarter. Final domestic demand increased 1.3% in Q3 2023.

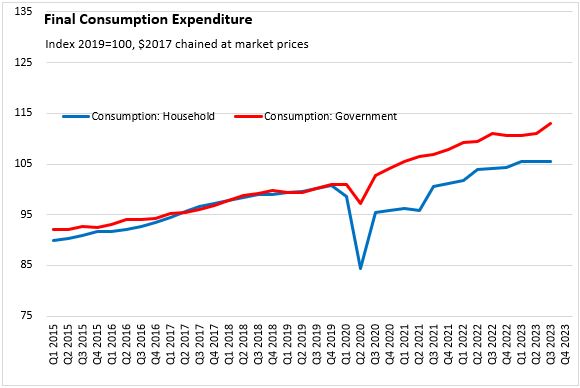
Household consumption growth edged up 0.1% in Q3. There was an increase in goods spending driven by new trucks, vans and sport utility vehicles, reflecting further improvements to previous supply chain challenges. Growth in services was offset by declines in spending on non-durable and semi-durable goods.
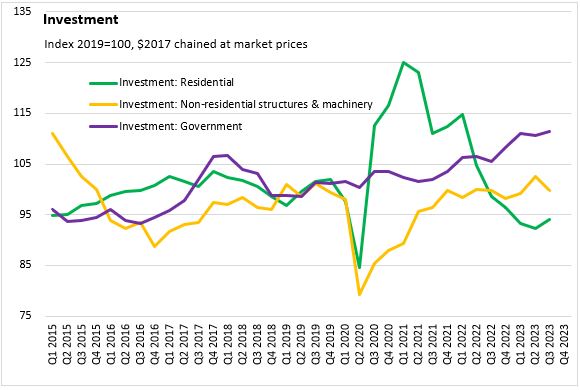
Residential investment increased 8.3% following five consecutive quarterly declines. Growth was driven by new construction, primarily in apartments across all provinces and the Northwest Territories. Statistics Canada notes that the Atlantic provinces posted the largest increases in new construction this quarter. Slower resale activity led to a decline in ownership transfer costs.
Non-residential investment in structures and machinery and equipment was down 10.1% for the quarter. Lower spending on engineering structures reflected the near completion of the Kitimat LNG project. Following a strong second quarter for aircraft and ships, Q3 recorded lower spending on aircraft and other transportation equipment. Spending on intellectual property products was down for the quarter as higher mineral exploration was fully offset by lower spending on software.
Government investment was up 2.4% in Q3.
Exports declined 5.1% as exports of refined petroleum energy products fell in Q3.
Imports declined by a seasonally adjusted annualized rate of 0.6% in Q3 due to declines in clothing, footwear and textiles, transportation services, and electronic and electrical equipment.

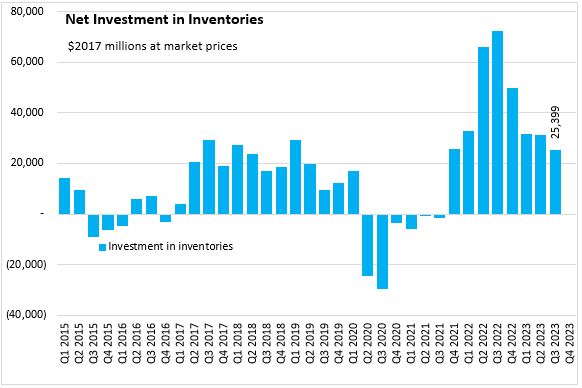
Investment in inventories was $25.4 billion in Q3, as inventories continue to slow after peaking in Q3 2022. After six consecutive quarters of inventory accumulation, manufacturers recorded a withdrawal in inventories. Statistics Canada reports that non-durable manufactured goods posted the largest quarterly withdrawal in inventories in Q4 2010.
The terms-of-trade (ratio of price of exports to price of imports) grew in Q3 driven by the rise in prices of exported goods, including crude oil and bitumen.
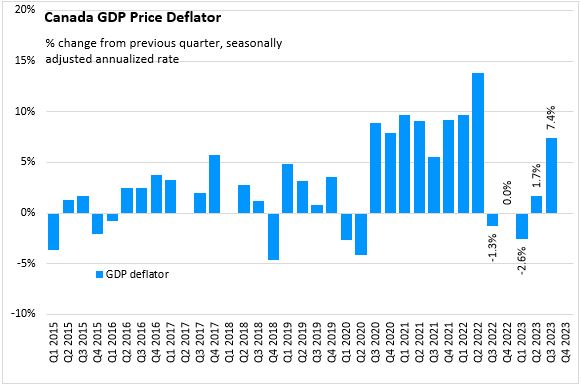
The overall GDP deflator (reflects overall price of domestically produced goods and services) was up 7.4% on annualized basis.
Nominal GDP increased at a seasonally adjusted annualized rate of 6.4% in Q3, following the 3.1% increase in Q2 2023.

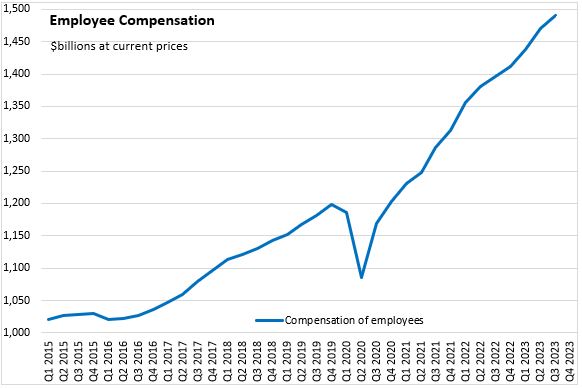
Employee compensation (measured in current prices, not real volumes) was up by a seasonally adjusted annualized rate of 5.4% in Q3. Wages were up in service producing industries but flat in goods producing industries. The largest increases in compensation were in professional and personal services, health services, and federal public administration (including military).
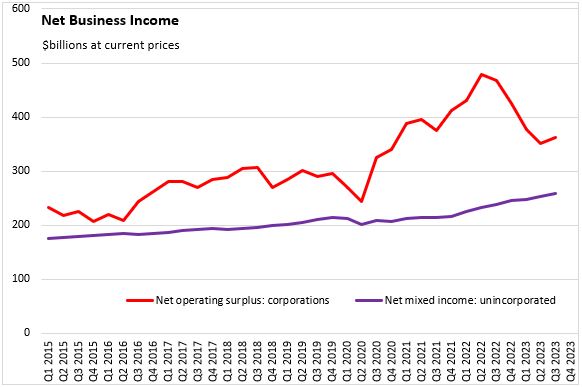
Higher operating surplus for non-financial companies was partly offset by declines for financial corporations. Higher prices for crude oil and refined petroleum products, as well as higher incomes across the motor vehicle supply chain contributed to higher profits in the non-financial sector. Net mixed income continued to increase in Q3.
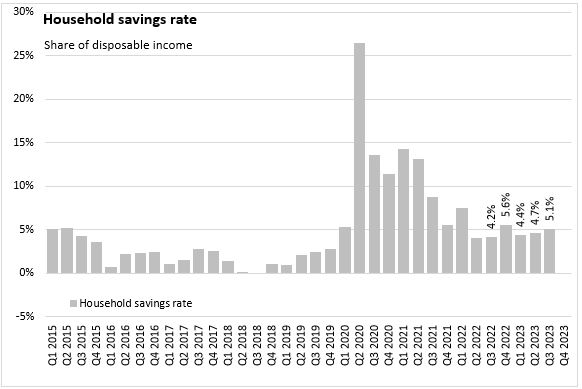
With slower growth in nominal household consumption expenditures, the household savings rate increased to 5.1% of disposable income in Q3.
Source: Statistics Canada. Gross domestic product, income and expenditure, second quarter 2020, Table 36-10-0103-01 Gross domestic product, income-based, quarterly (x 1,000,000), Table 36-10-0104-01 Gross domestic product, expenditure-based, Canada, quarterly (x 1,000,000), Table 36-10-0111-01 Current and capital accounts - National, Canada, quarterly
<--- Return to Archive