The Economics and Statistics Division maintains archives of previous publications for accountability purposes, but makes no updates to keep these documents current with the latest data revisions from Statistics Canada. As a result, information in older documents may not be accurate. Please exercise caution when referring to older documents. For the latest information and historical data, please contact the individual listed to the right.
<--- Return to Archive
For additional information relating to this article, please contact:
October 12, 2023LIFE SATISFACTION AND QUALITY OF LIFE, Q2 2023 Statistics Canada has updated and expanded its data about how Canadians perceive their quality of life. This information is collected as part of the Canadian Social Survey, conducted from April 21 - June 4, 2023. This survey reports on Canadians' overall satisfaction with life, sense of meaning and purpose, loneliness, having someone on whom to depend on when needed, hope for the future, sense of belonging to community, satisfaction with time use, satisfaction with local environment, confidence in institutions, perceived mental health, perceived overall health and difficulty meeting financial needs. National data does not include any results from the Territories.
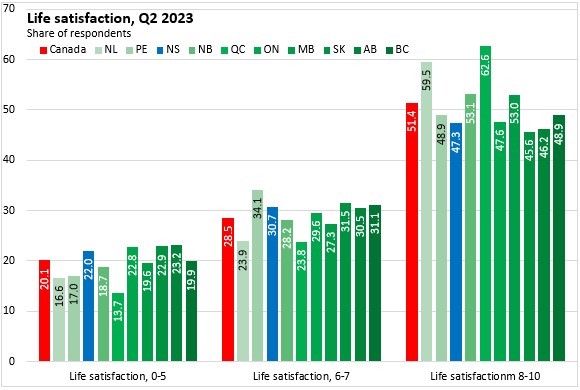
Life satisfaction
Respondents were asked "How do you feel about your life as a whole right now?, " where 0 meant "Very dissatisfied" and 10 meant "Very satisfied."
In Nova Scotia, 47.3% of respondents rated their life satisfaction in the most satisfied categories (8-10) while 22.0% responded with the least satisfied categories (0-5). Across Canada, 51.4% of the respondents were in the most satisfied categories while 20.1% were in the least satisfied categories. High life satisfaction (8-10) was most prevalent in Québec and Newfoundland and Labrador while it was least prevalent in Alberta and Saskatchewan.
Hopeful Outlook for the Future
Respondents were asked how often they felt hopeful about the future.
57.0% of Nova Scotians reported feeling hopeful about the future always or often while 12.0% of Nova Scotians rarely or never felt hopeful about the future. Feelings of hopefulness (always or often) were most prevalent in Québec and Manitoba. Albertans were least likely to always or often feel hopeful about the future.

Someone to Depend on When Needed
Respondents were asked whether they felt they had someone on whom to depend on when needed.
In Nova Scotia, 74.8% of the population felt they always or often had someone on whom to depend when needed. Across Canada, 71.2% of respondents felt they always or often had someone upon whom to rely (highest: Québec, Nova Scotia and Manitoba; lowest: Ontario).
6.1% of Nova Scotians felt they rarely or never had someone upon whom to rely, the lowest such prevalence among provinces.

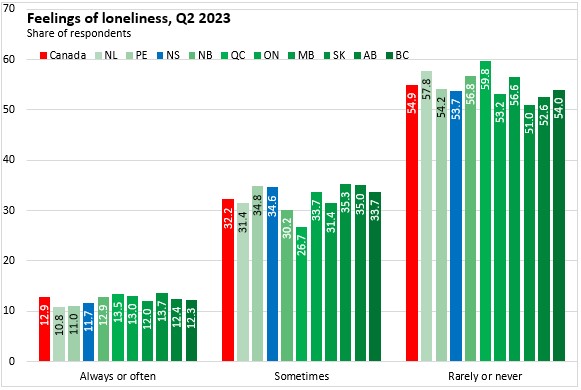
Loneliness
Survey respondents were asked about the frequency of feelings of loneliness.
In Nova Scotia, 53.7% of the population reported rarely or never feeling lonely. A further 34.6% reported feeling lonely sometimes while 11.7% reported feeling lonely often or always.
Nationally, 54.9% of the population are rarely or never lonely, 34.6% are lonely sometimes and 12.9% are often or always lonely. The share of the population that are rarely or never lonely was highest in Québec and lowest in Saskatchewan. The share of the population reporting frequent loneliness was lowest in Newfoundland and Labrador and highest in Manitoba.
Sense of Meaning and Purpose
Respondents were asked whether the things to do in life felt worthwhile, ranked on a scale of 0 to 10 where '0' indicated 'not at all worthwhile' and '10' indicated 'completely worthwhile'.
In Nova Scotia, 55.9% of respondents replied in the three strongest categories (8-10) for sense of meaning and purpose. This was below the national average of 58.3%; the highest share of respondents in these categories were in Newfoundland and Labrador and Québec while the lowest were in New Brunswick and British Columbia.
17.5% of Nova Scotians responded that their sense of meaning and purpose in the things they do in life were in the lowest categories (0-5). The national average response in the lowest categories was 15.6%.

Sense of Belonging to Community
Respondents to the survey were asked about their sense of belonging to their local community. In Nova Scotia 46.2% of respondents indicated a somewhat or very strong sense of belonging to their community - very similar to the national average of 46.1% of Canadians. A strong sense of belonging to community was more prevalent in Prince Edward Island and less prevalent in Ontario.
In Nova Scotia, 38.5% of respondents reported a somewhat or very weak sense of belonging to community - the highest prevalence among provinces.

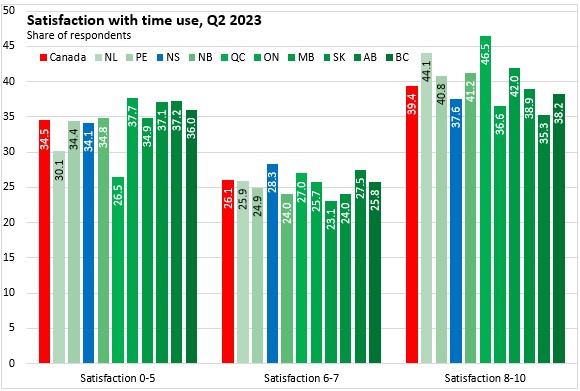
Satisfaction with Time Use
Satisfaction with amount of free time (satisfaction with time use) is measured on a scale from 0 to 10. Respondents were asked, “On a scale from 0 to 10, where 0 means ‘Very dissatisfied’ and 10 means ‘Very satisfied,’ how satisfied are you with the amount of time you have to do the things that you like doing?”
About one third of Nova Scotians (34.1%) reported low satisfaction with time use (0-5). This was similar to the national average. Low satisfaction with time use was more prevalent in Ontario, Alberta and Saskatchewan.
37.6% of Nova Scotians reported the highest levels of satisfaction with time use, which was below the national average (39.4%). Respondents in Québec reported the highest satisfaction with time use.
Satisfaction with local environment
Satisfaction with local environment is measured on a scale from 0 to 10. Respondents were asked, “On a scale from 0 to 10, where 0 means ‘Very dissatisfied’ and 10 means ‘Very satisfied,’ how satisfied are you with the quality of your local environment such as access to green space, and air or water quality?”
In Nova Scotia, 58.3% of respondents reported the highest levels of satisfaction with the local environment - about the same as the national average. High satisfaction with the local environment was most prevalent in Prince Edward Island and least prevalent in Ontario and Saskatchewan (though those in Ontario were most likely to report satisfaction with the local environment at levels 6 or 7).

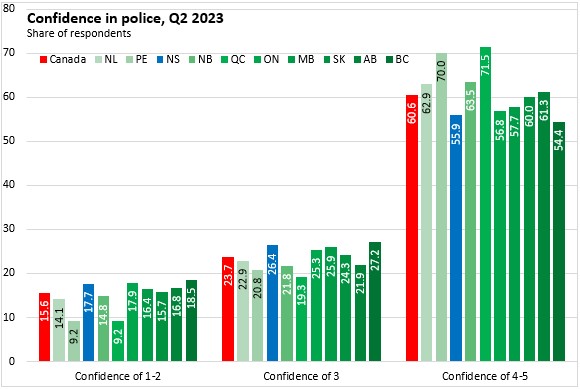
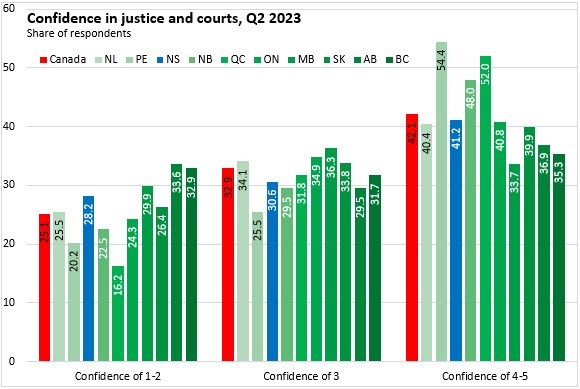
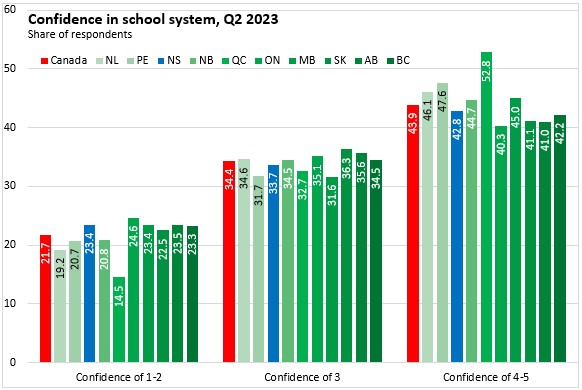
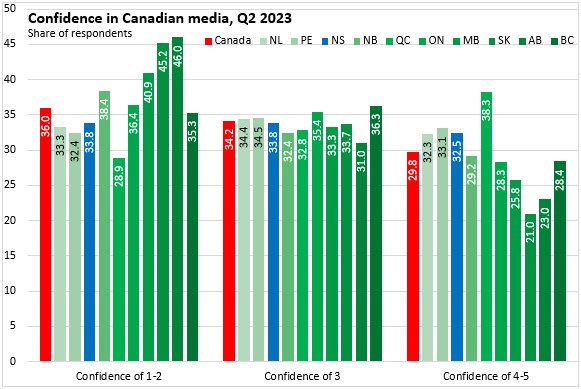
Confidence in Institutions
Confidence in institutions is measured on a scale from 1 to 5. Respondents were asked, “Using a scale of 1 to 5 where 1 means ‘No confidence at all’ and 5 means ‘A great deal of confidence,’ how much confidence do you have in the following institutions: the police, the justice system and courts, the school system, the Federal Parliament, the Canadian media?”
Canadians generally reported higher levels of confidence in the police with somewhat lower levels of confidence for the justice/courts and school systems. Strong confidence in the Federal Parliament and Canada's media was less prevalent.

Perceived mental and overall health
Respondents were asked, “In general, how is your mental health?”, where possible response categories included “Excellent,” “Very good,” “Good,” “Fair” and “Poor.”
Nova Scotians were the most likely to report fair or poor mental health (27.2%).

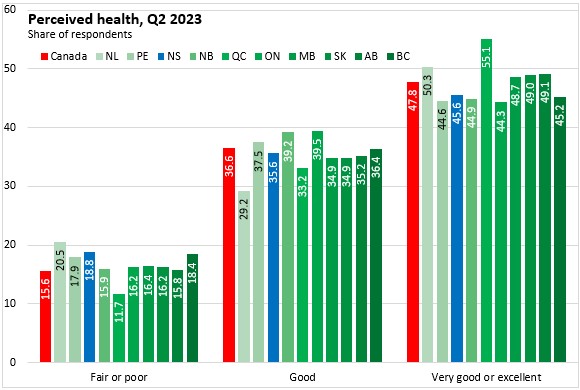
Respondents were asked, “In general, how is your health?”, where possible response categories included “Excellent,” “Very good,” “Good,” “Fair” and “Poor.”
Nova Scotians were more likely to report fair or poor health (18.8%) than the national average (15.6%).
Meeting Financial Needs
Respondents were asked, “In the past 12 months, how difficult or easy was it for your household to meet its financial needs in terms of transportation, housing, food, clothing and other necessary expenses?”, where possible response categories included “Very difficult,” “Difficult,” “Neither difficult nor easy,” “Easy” and “Very easy.”
Nova Scotians were less likely to report either ease or difficulty in meeting financial needs. 42.2% of Nova Scotians reported neither ease nor difficulty in meeting financial needs - the highest prevalence of this response among provinces.

Source: Statistics Canada. Table 13-10-0843-01 Life satisfaction by gender and province; Table 13-10-0845-01 Sense of meaning and purpose by gender and province; Table 13-10-0847-01 Future outlook by gender and province; Table 45-10-0048-01 Loneliness by gender and province; Table 45-10-0050-01 Having someone to count on by gender and province; Table 45-10-0052-01 Sense of belonging to local community by gender and province; Table 45-10-0067-01 Satisfaction with time use, by gender and province; Table 45-10-0069-01 Satisfaction with local environment, by gender and province; Table 45-10-0073-01 Confidence in institutions, by gender and province; Table 45-10-0079-01 Perceived mental health, by gender and province; Table 45-10-0081-01 Perceived health, by gender and province; Table 45-10-0086-01 Difficulty meeting financial needs, by gender and province
<--- Return to Archive