The Economics and Statistics Division maintains archives of previous publications for accountability purposes, but makes no updates to keep these documents current with the latest data revisions from Statistics Canada. As a result, information in older documents may not be accurate. Please exercise caution when referring to older documents. For the latest information and historical data, please contact the individual listed to the right.
<--- Return to Archive
For additional information relating to this article, please contact:
October 04, 2023HOUSEHOLD WEALTH, Q2 2023 Household Assets, Liabilities and Net Worth
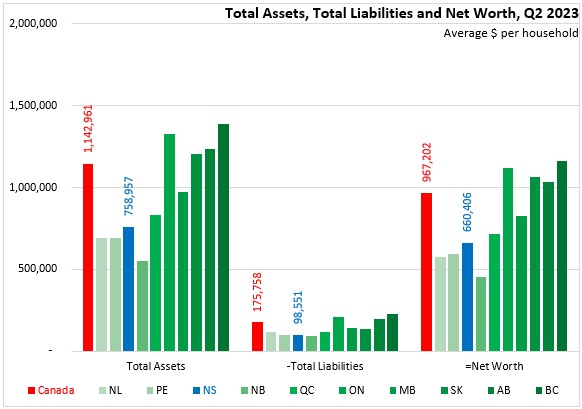
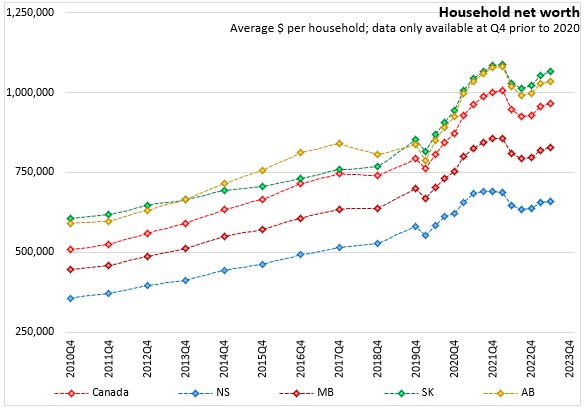
Canada’s average assets were $1,142,961 in Q2 2023. Nova Scotia’s assets were well below the national average at $758,957. Nova Scotia also had the second lowest liabilities amounts at $98,551. As a result, Nova Scotia's net worth came to $660,406 per household. Nova Scotia’s average household wealth was the highest among the Atlantic provinces. British Columbia and Ontario had the highest household wealth among all provinces.
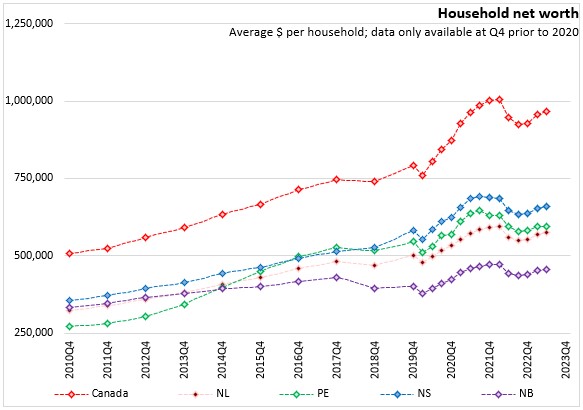
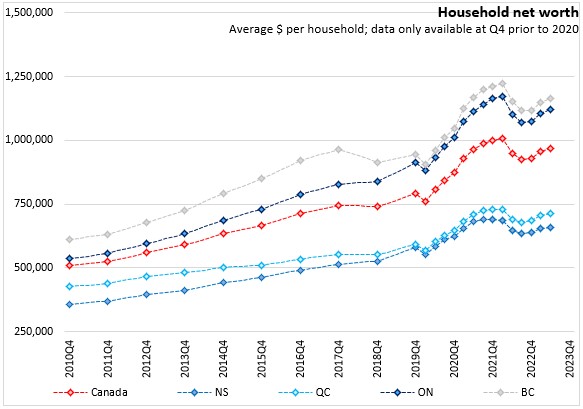
Nova Scotia's net worth grew by 0.9% from Q1 2023 to Q2 2023. Canada's household net worth grew 1.2% with all provinces reporting growth. Newfoundland and Labrador reported the largest growth and Prince Edward Island reported the smallest growth.

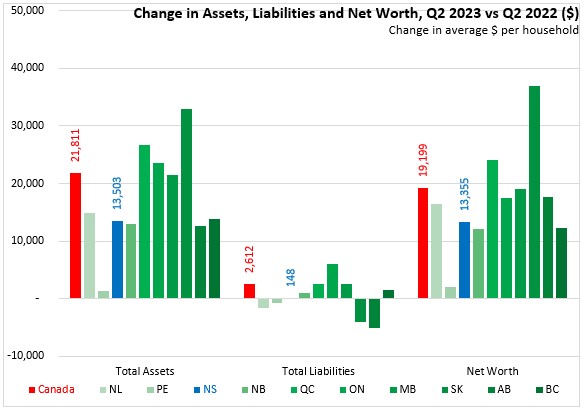
Compared to Q2 2022, national assets per household increased by $21,811 while liabilities increased by $2,612, bringing national net worth up by $19,199. Nova Scotia’s assets increased by $13,503 while liabilities grew by $148 from 2022 Q2 to 2023 Q2, increasing Nova Scotia's net worth per household by $13,355.
In detailed assets and liabilities Nova Scotians continued to have the highest life insurance and pension assets per household. British Columbia and Ontario had real estate assets far above the national average of $505,028.
The national level for Mortgage Liabilities in Q2 2023 was $128,927. Nova Scotia mortgage liabilities per household were the second lowest among provinces at $56,600. Other non-mortgage liabilities for Nova Scotia were below national average at $41,951 per household.

Nova Scotia's per household life insurance and pension assets increased by $7,271 from Q2 2022 to Q2 2023. Nova Scotia’s other financial assets in Nova Scotia increased by $14,455. Nova Scotia’s real estate assets fell by $7,369 per household from Q2 2022 to Q2 2023. Nationally, average real estate assets per household declined $11,011 with the largest declines in Alberta, British Columbia, and Saskatchewan.
Nova Scotia's mortgage liabilities rose by $466. The national average mortgage liability per household increased by $2,244. Nova Scotia's other liabilities decreased by $318 while the national average over the four quarters increased by $368.

Household net worth has grown in each province during the last three quarters following two quarters of decline.
Source: Statistics Canada. Table 36-10-0661-01 Distributions of household economic accounts, wealth, Canada, regions and provinces, quarterly (x 1,000,000)
<--- Return to Archive