The Economics and Statistics Division maintains archives of previous publications for accountability purposes, but makes no updates to keep these documents current with the latest data revisions from Statistics Canada. As a result, information in older documents may not be accurate. Please exercise caution when referring to older documents. For the latest information and historical data, please contact the individual listed to the right.
<--- Return to Archive
For additional information relating to this article, please contact:
May 12, 2023HALIFAX BUSINESS CONDITIONS: MAY 1-7, 2023 Statistics Canada has released real-time local business conditions from May 1 to May 7, 2023.
With this release, Statistics Canada has changed their date convention - data are now reported up to the previous week and reference dates reported now refer to the end of the week.
Note that these data are not adjusted for seasonality and monthly or weekly changes may simply reflect regular seasonal patterns.
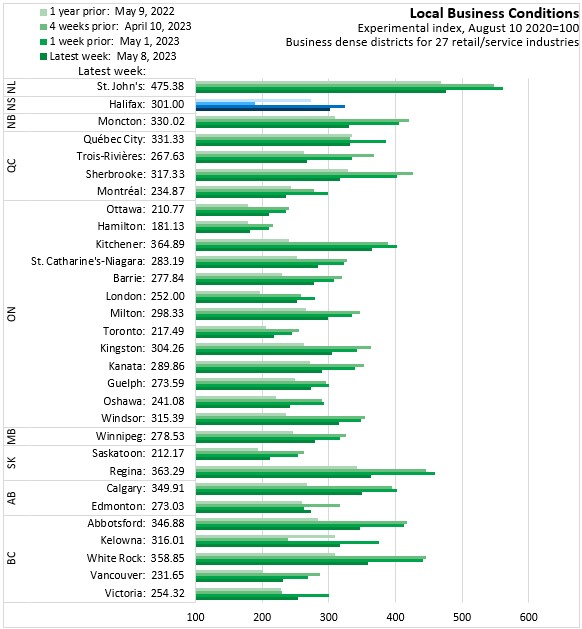
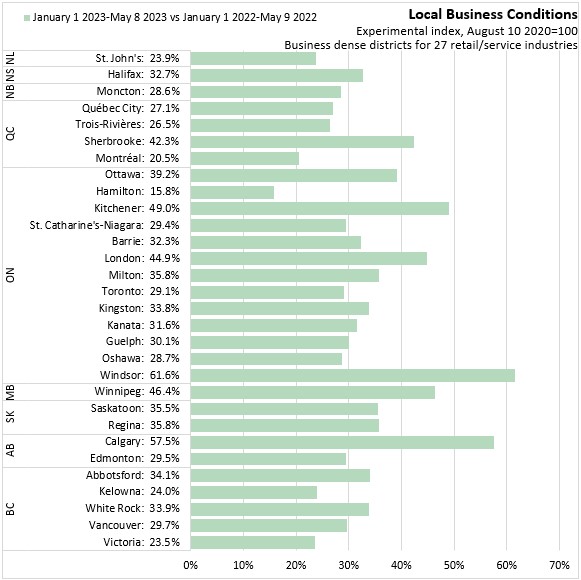
From August 10 of 2020 to May 8, 2023, the local business conditions index for Halifax has increased by 201.0%. In percentage terms, St. John's reported the strongest growth in business conditions over this period while Hamilton had the smallest gains.
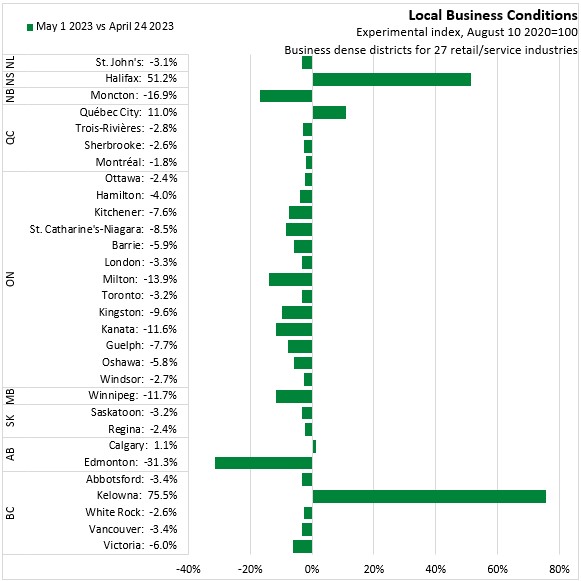
From April 24 to May 1, Halifax business conditions reported a substantial 51.2% improvement while most cities reported an erosion in business conditions. Only Kelowna reported a stronger increase. Edmonton reported the largest decline in this period.
In the week of May 1 to May 8, Halifax business conditions declined by 7.2%. Business conditions deteriorated in most cities with Edmonton reporting the lone gain. Sherbrooke reporting the largest drop. Sherbrooke, Montréal and Regina reported the largest declines.

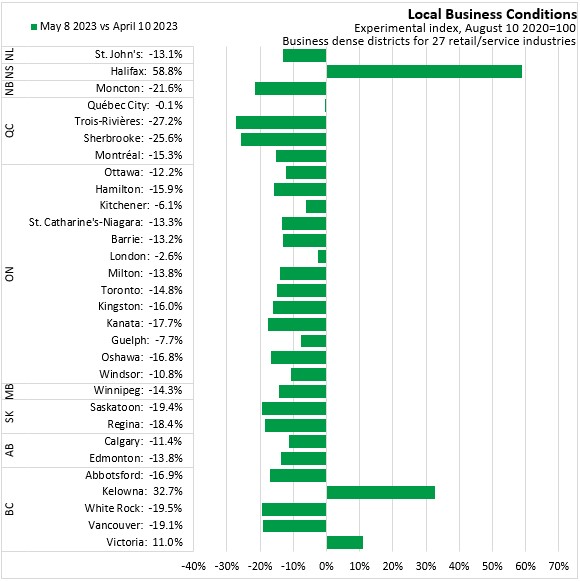
Compared with 4 weeks prior, business conditions increased 58.8% in Halifax, the strongest increase among cities (mostly reflecting the strong gain from two weeks ago). Business conditions generally declined across the country with Trois-Rivières reporting the largest loss.
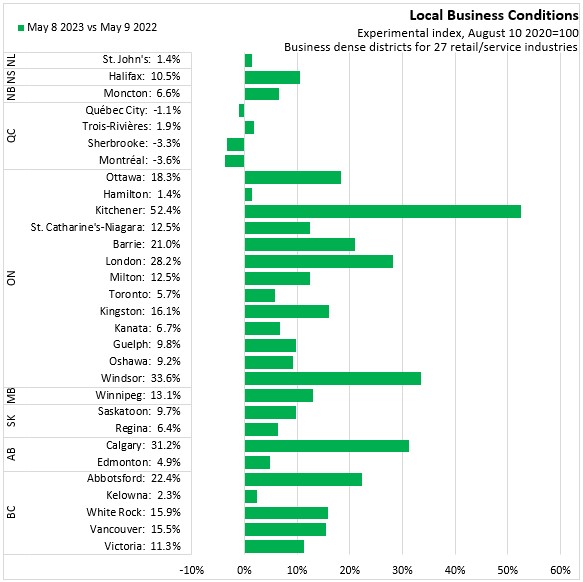
Compared with the same week a year ago, Halifax business conditions have improved by 10.5%. All cities except Sherbrooke, Montréal and Québec City reported improvements. Kitchener reported the largest increase.
As the experimental business conditions index is both volatile and unadjusted for seasonality, a comparison of year-to-date averages may generate more stable (if less current) insights into changing business conditions.
Compared with the first 18 weeks of 2022, Halifax business conditions were up 32.7% in the same period of 2023. Over this period, Windsor reported the largest gain while Hamilton reported the smallest. No urban centres reported a year-to-date decline in business conditions.
Halifax's business conditions generally follow trends observed in Canada's largest urban centres, with exceptions during spikes from events like tropical storm Fiona and the World Junior Hockey Championship. Halifax's business conditions typically deteriorate more than others in the first months of the year. Halifax's business conditions were weaker than in other major urban centres until the end of April, when there was a large improvement (a similar increase was observed at the same time in 2022).
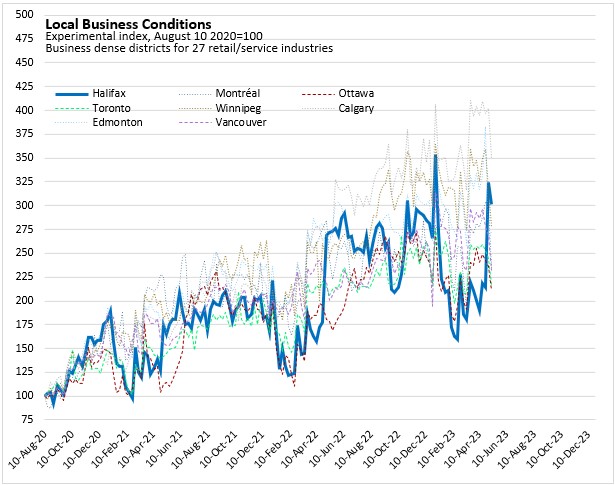
With the large improvement at the end of April, Halifax business conditions are now more consistent with several medium-sized cities across Canada.
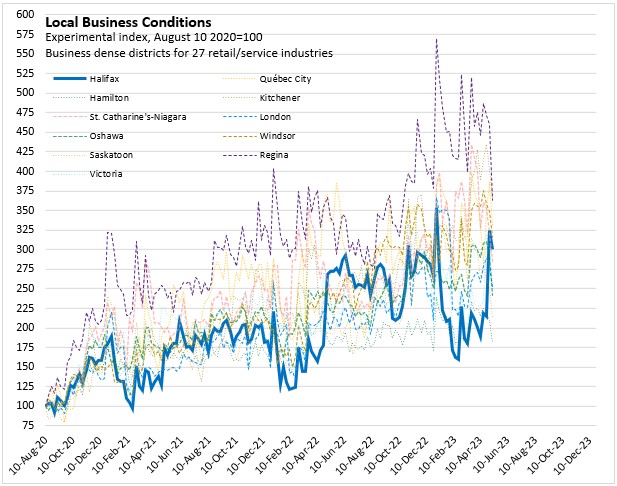
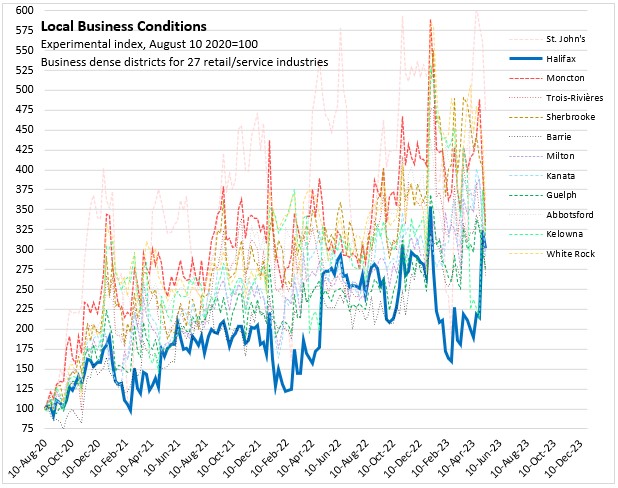
Despite Halifax's large improvement at the end of April and large declines across smaller population centres, Halifax's business conditions continue to lag improvements in most smaller urban centres (exceptions: Trois-Rivières, Kanata, Guelph).
Notes
This experimental data product starts from information on the number of businesses listed in the business register in "business dense areas" of a large urban centre. Data from 2019 business locations provided baseline (ie: pre-pandemic) insight on business revenue and employment.
The data focus on 27 industries in particular: retail bakeries, furniture stores, electronics/appliance stores, building materials/garden supply stores, food/beverage stores, gas stations/convenience stores, clothing stores, cycling stores, book stores, general merchandise stores, florists, cinemas, dental offices, museums, zoos/gardens, amusement/theme parks, casinos, fitness/recreation centres, bowling alleys, drinking places, restaurants, and personal care services (such as hair care or esthetics).
Data on current operating conditions (open vs. closed) were collected from commercial application-program interfaces (API). Most of the information is drawn from Google's Places API, which is similar to what is available publicly on Google Maps, with supplementary information from APIs offered by Yelp Fusion and Zomato. Queries to the API are based on a sampling approach ('density-based cursory search') that focuses on the densest areas for business locations in the selected industries. Statistics Canada cautions that the sampling methods used do not follow standard statistical methods due to cost and technical limitations.
Data on current traffic volumes were drawn from TomTom's historical traffic information. As with operating conditions, the information was drawn from a sample of routes within identified business-dense areas. Statistics Canada cautions that traffic volume estimates and their relationship to business conditions may be sensitive to changing traffic patterns, construction/detours, and changes to business models such as curbside pickup or delivery.
The index of real-time local business conditions is estimated as the value of retail revenue, adjusted for both percentage of reported business closures as well as changes in traffic volumes from pre-pandemic levels.
The value of the index was set to 100 as of August 2020. As such, the index shows changes since then, but does not represent the variations in business conditions that existed in the initial period. A location with strong local business conditions in August 2020 would have less opportunity to grow than a location with weak conditions in the same month.
Source: Statistics Canada. Table 33-10-0398-01 Real-time Local Business Condition Index (RTLBCI)
Statistics Canada catalogue 71-607X. Real-Time Local Business Conditions Index: Concepts, data, methodology, https://publications.gc.ca/collections/collection_2021/statcan/71-607-x/71-607-x2021017-eng.pdf, July 15, 2021
<--- Return to Archive