The Economics and Statistics Division maintains archives of previous publications for accountability purposes, but makes no updates to keep these documents current with the latest data revisions from Statistics Canada. As a result, information in older documents may not be accurate. Please exercise caution when referring to older documents. For the latest information and historical data, please contact the individual listed to the right.
<--- Return to Archive
For additional information relating to this article, please contact:
March 31, 2023HOUSEHOLD INCOME AND CONSUMPTION, Q4 2022 Household Income
In addition to compensation of employees, household income also includes net mixed income (generated from unincorporated businesses), property income received (generated as the result of ownership of assets) and current transfers received (generally from government).
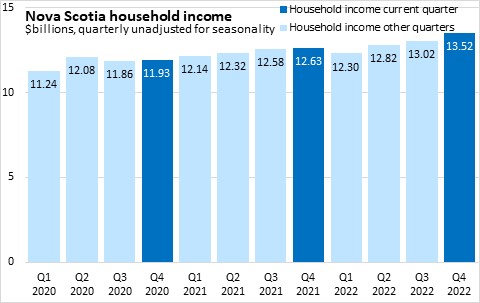
In Q4 2022, Nova Scotia's household income was $13.52 billion or $28,697 per household. Nova Scotia's income per household amounted to 78.3% of the national average per household. The highest income per household was in Alberta and lowest in Prince Edward Island.
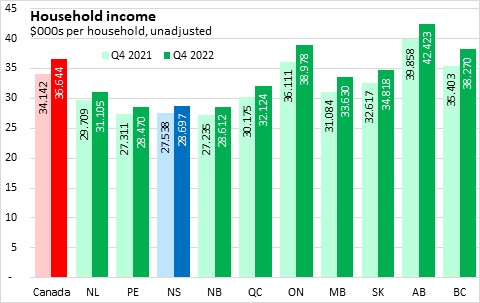
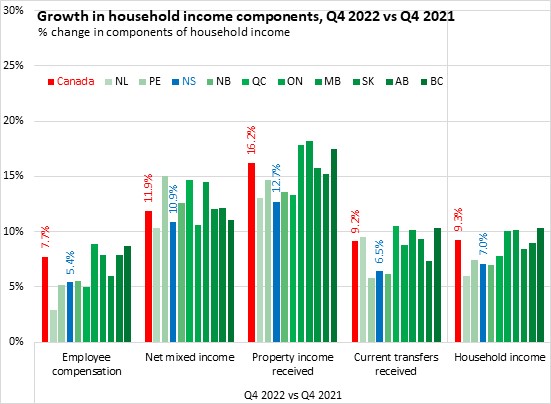
From Q4 2021 to Q4 2022, Nova Scotia's overall household income increased 7.0% National household income growth was 9.3% with the fastest growth in British Columbia, Manitoba and Ontario. All ten provinces reported rising household income. Newfoundland and Labrador reported the slowest household income growth among provinces.
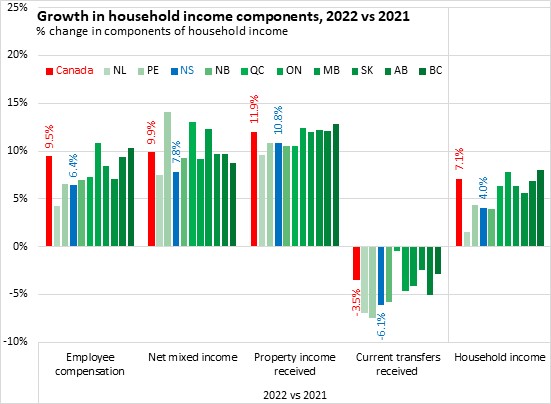
In 2022, Nova Scotia's household income increased by 4.0% compared with 2021.
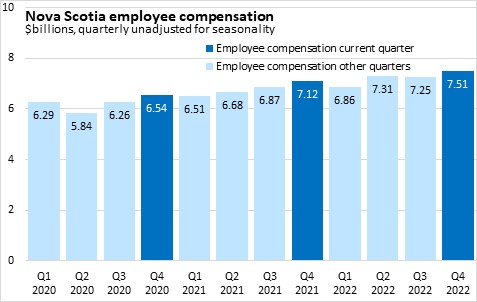
Nova Scotia's employee compensation was $7.51 billion in Q4 2022 or $15,942 per household (73.1% of the national average per household). Across Canada, employee compensation per household was $21,796. Alberta reported the highest employee compensation per household and Prince Edward Island the lowest.
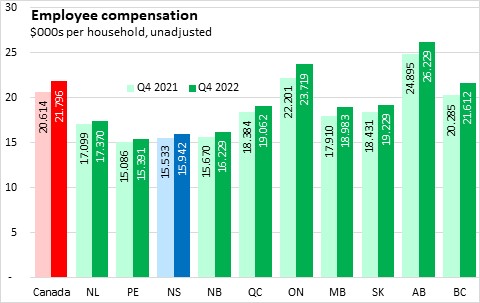
Nova Scotia's overall employee compensation was up 5.4% from Q4 2021 to Q4 2022. National employee compensation increased 7.7%.
Nova Scotia's employee compensation grew by 6.4% on average in 2022 compared with 2021. Nationally, employee compensation was up 9.5% in 2022 with fastest pace in Ontario (+10.9%) and the slowest pace in newfoundland and Labrador (+4.2%).
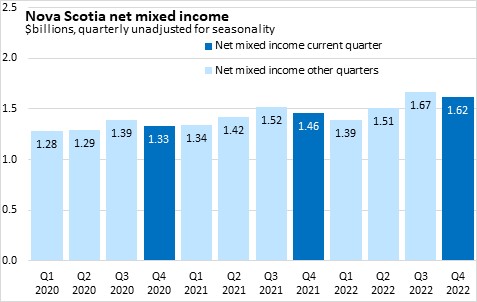
Net mixed income generated by unincorporated businesses amounted to $1.62 billion or $3,438 per household (88.8% of the national average per household). Across Canada, average per household net mixed income was $3,870 with the highest values in British Columbia and the lowest in Quebec.
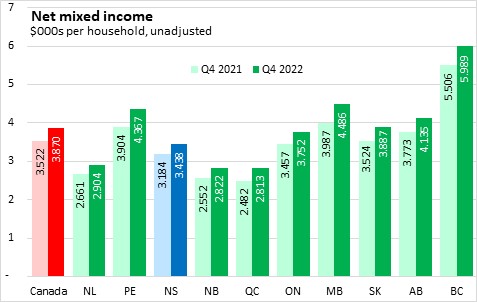
From Q4 2021 to Q4 2022, Nova Scotia's net mixed income grew by 10.9% (+11.9% nationally).
Through 2022, Nova Scotia's net mixed income was up 7.8% compared 2021. Nationally, net mixed income rose 9.9% in 2022 with the fastest growth in Prince Edward Island (+14.1%) and the slowest in Newfoundland and Labrador (+7.5%).
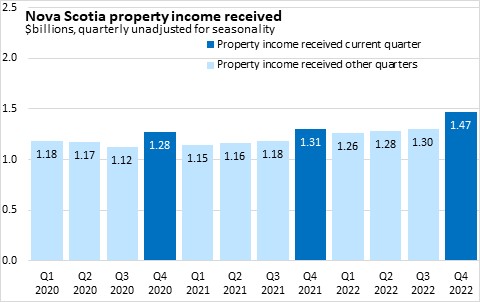
Nova Scotia property income received in Q4 2022 was $1.47 billion or $3,123 per household (75.8% of the national average). National property income per household was $4,119 with the highest values in Alberta and the lowest values in Newfoundland and Labrador.
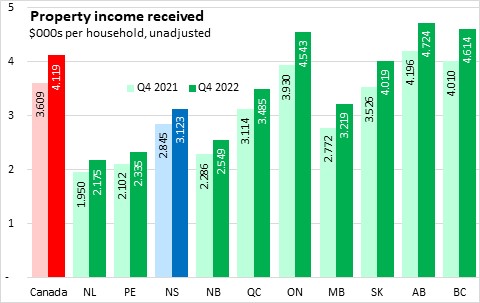
From Q4 2021 to Q4 2022, property income receipts increased by 12.7% in Nova Scotia - slower than the national pace of 16.2%.
For 2022, Nova Scotia's property income receipts grew 10.8%, slighly slower than the national pace of 11.9%
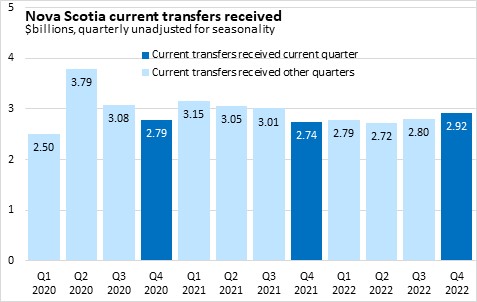
Current transfers received in Nova Scotia were up to $2.92 billion or $6,194 per household in Q4 2022. Current transfers received in Nova Scotia were 90.3% of the national average per household ($6,859). Transfers per household were highest in Newfoundland and Labrador and lowest in British Columbia.

Compared with Q4 2021, the most recent quarterly transfer income received in Nova Scotia was up 6.5% (+9.2% nationally).
For 2022 transfers received in Nova Scotia were down 6.1% compared with 2021. With COVID-19 transfers expiring, nationally transfers received were down 3.5% in 2022 with declines in all provinces.
Household Consumer Expenditures
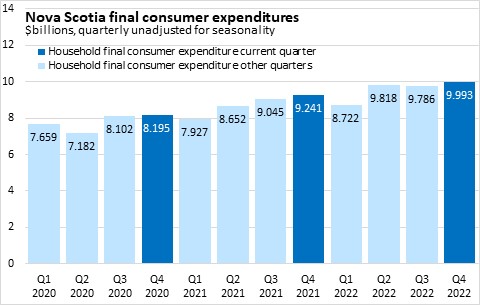
Nova Scotia's final consumer expenditures (paid for private by households) amounted to $9.993 billion in Q4 2022. This was $21,217 per household (90.2% of the national average per household). Across Canada, final consumer expenditures per household were $23,510 with the highest value in British Columbia and the lowest in Quebec.

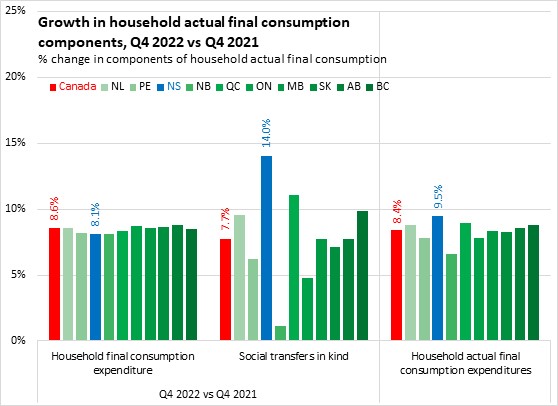
Between Q4 2021 and Q4 2022, final consumer expenditures increased by 8.1% (+8.6% nationally), which includes the effects of price increases over this period.
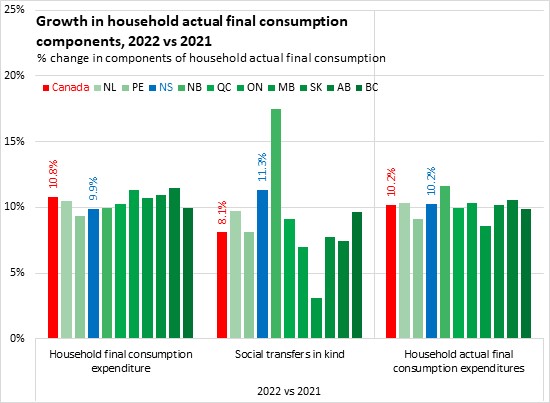
On average in 2022, Nova Scotia's household final consumer expenditures were up 9.9% over 2021. Nationally, household final consumption expenditures were up 10.8% in 2022.
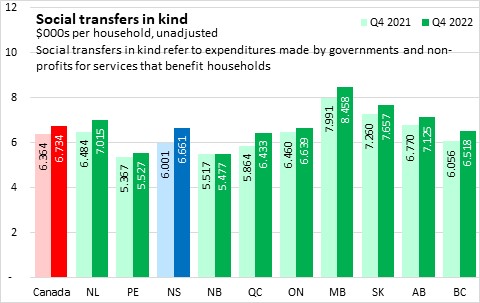
Social transfers in kind refer to services that are provided for the benefit of households but are paid for by governments and non-profits. These are primarily health and education expenditures, which add to private expenditures made on these services.
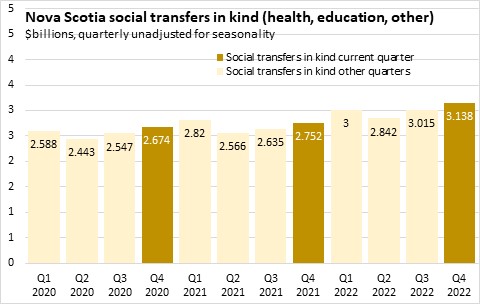
In Q4 2022, Nova Scotian households received $3.14 billion worth of social transfers in kind. This amounted to $6,661 per household (98.9% of the national average per household). Across Canada, social transfers in kind were $6,734 per household with the highest values in Manitoba and the lowest values in New Brunswick.
Between Q4 2021 and Q4 2022, the value of social transfers in kind in Nova Scotia increased by 14.0% while there was a 7.7% increase nationally.
In 2022 compared with 2021, Nova Scotia's social transfers in kind were up 11.3%. Nationally, social transfers in kind were up 8.1% with fastest growth in New Brunswick (+17.5%) and the slowest in Manitoba (+3.1%).
The sum of household final consumer expenditures and social transfers in kind is termed 'household actual final consumption expenditures', which reflects the benefits to households from both private expenditures as well as services provided by governments and non-profits.
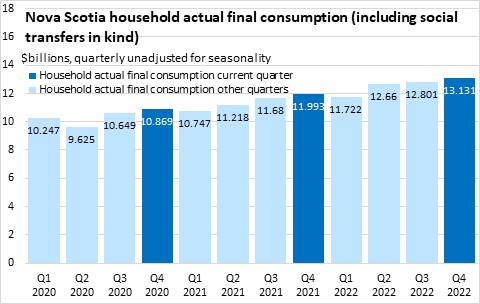
Nova Scotia's household actual final consumption expenditures in Q4 2022 were $13.13 billion or $27,878 per household (92.2% of the national average per household). National household actual final consumption expenditures were $30,244 per capita with the highest value in Alberta and the lowest value in Quebec.
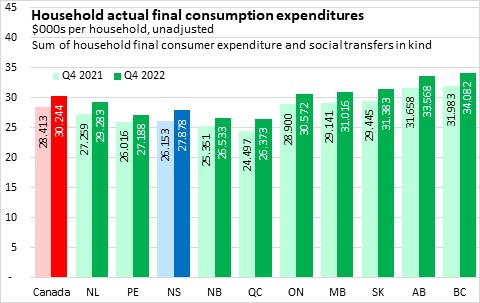
From Q4 2021 to Q4 2022, household actual final consumption expenditures increased by 9.5% in Nova Scotia (+8.4% nationally).
For 2022 actual final consumption was up 10.2% in both Nova Scotia and Canada.
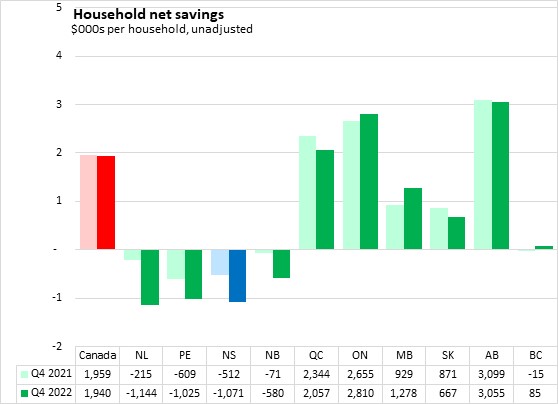
Household net savings (which includes changes in pension entitlements) increased during the pandemic. These effects appear to have been temporary and savings are returning to prior trends. After saving an average of -$512 per household in Q4 2021, Nova Scotia's net savings per household were -$1,071 in Q4 2022. Ontario, Manitoba, and British Columbia reported increasing net household savings in Q4 2022 (compared with Q4 2021).
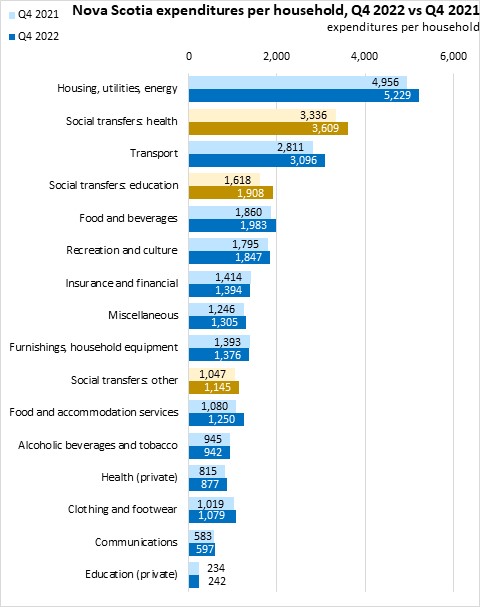
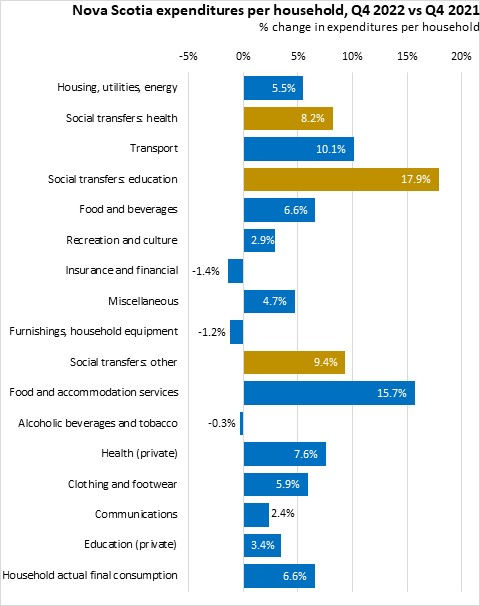
Among the categories of actual final consumption expenditures, growth in per household spending was fastest for social transfers in education and food service and accommodation comparing Q4 2022 with Q4 2021. Average per household expenditures were up in most categories with only small declines in insurance/financial, furnishings/household equipment and alcoholic beverages/tobacco.
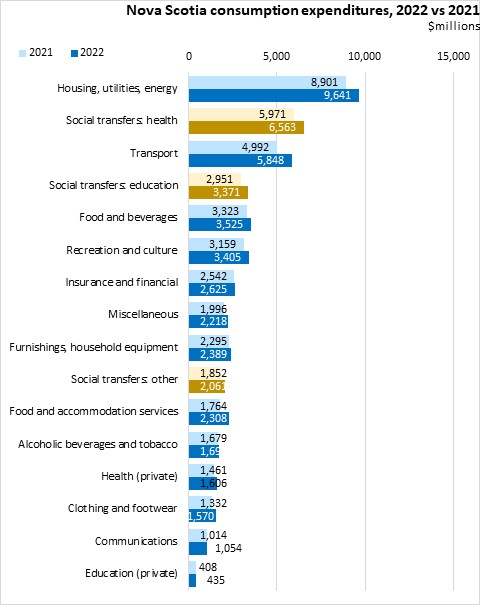
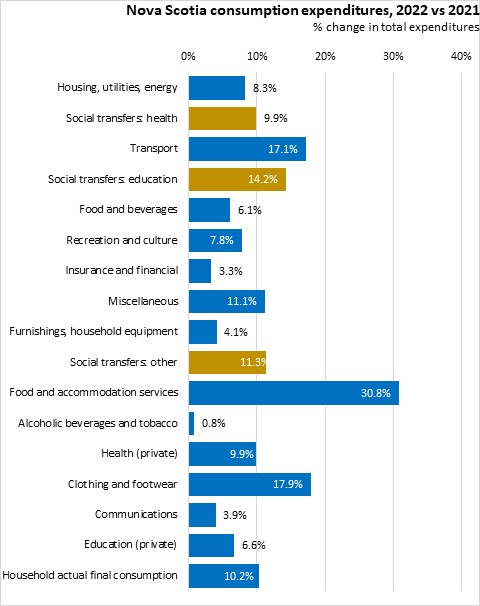
Over 2022, total expenditures (not per household) were up all categories. The largest percentage changes were in food service/accommodations and clothing/footwear. Expenditures had the smallest growth in alcoholic beverages/tobacco.
Source: Statistics Canada. Table 36-10-0663-01 Distributions of household economic accounts, income, consumption and saving, Canada, provinces and territories, quarterly (x 1,000,000)
<--- Return to Archive