The Economics and Statistics Division maintains archives of previous publications for accountability purposes, but makes no updates to keep these documents current with the latest data revisions from Statistics Canada. As a result, information in older documents may not be accurate. Please exercise caution when referring to older documents. For the latest information and historical data, please contact the individual listed to the right.
<--- Return to Archive
For additional information relating to this article, please contact:
March 28, 2023HOUSEHOLD ACTUAL FINAL CONSUMPTION, 2021 Statistics Canada's system of macroeconomic accounts measures household final consumption based on purchases of final goods and services from market sources by households. Household actual final consumption expenditures expand this to include the value of goods and services provided to households in kind by governments and non-profit institutions.
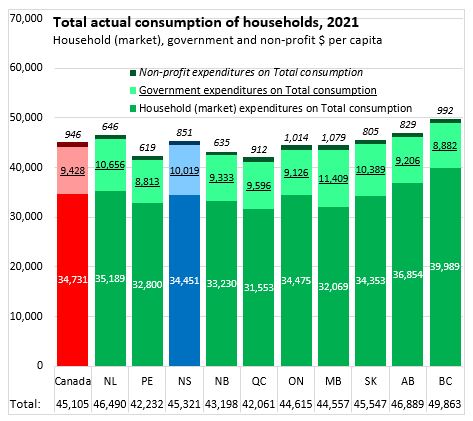
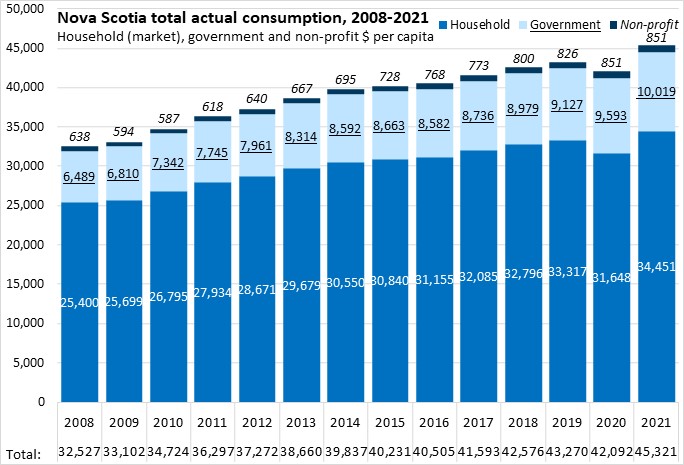
In 2021, household final consumption expenditures on market goods and services amounted to $34,451 per capita in Nova Scotia. Nationally, per capita household final consumption expenditures on market goods and services were $34,731 - ranging from a high of $39,989 in British Columbia to a low of $31,553 in Quebec.
The value of government services added $10,019 per capita to household consumption in Nova Scotia while non-profit institutions added $851 per capita. Across Canada, government expenditures added $9,428 to per capita household consumption while non-profits added a total of $946. Government expenditures for households was highest in Manitoba at $11,409 per capita and lowest in Prince Edward Island at $8,813 per capita. Non-profit expenditures for households were highest in Manitoba ($1,079 per capita) and were lowest in Prince Edward Island ($619 per capita).
Household actual final consumption in Nova Scotia (including market, government and non-profit) amounted to $45,321 per capita, which was $216 more than the national average of $45,105 per capita. The highest household actual final consumption was in British Columbia at $49,863 and lowest in Quebec at $42,061.
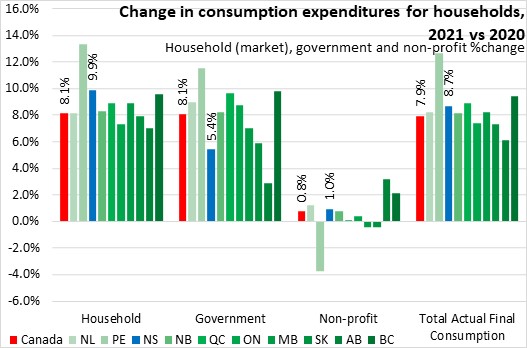
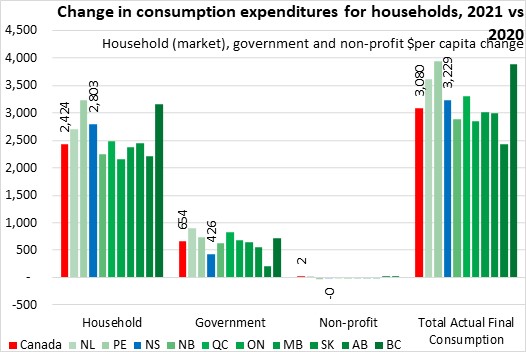
Compared with 2020, the value of total actual household consumption expenditures increased by 8.7% in Nova Scotia and by 7.9% nationally. Most of the increase was accounted for by higher household consumer expenditures previously affected by the COVID-19 pandemic in 2020. Government expenditures for households, which were up in all provinces. Non-profit expenditures for households were down in Prince Edward Island, Manitoba and Saskatchewan.
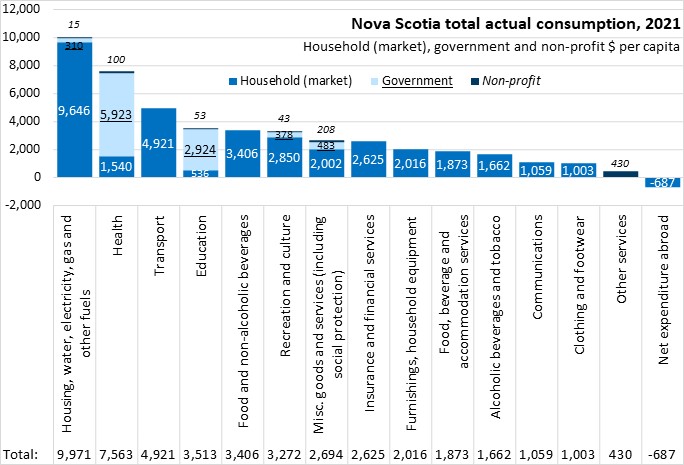
Looking across all household consumption categories in Nova Scotia, housing and utilities was the largest expenditure category. Most of these expenditures were market-based expenditures by households themselves, with small additions from government and non-profit expenditures on behalf of Nova Scotia households. Health care, transportation, education and food were the next largest categories of total actual household consumption. The bulk of health and education expenditures on behalf of Nova Scotia households were made by governments while food and transportation were entirely household expenditures. There were smaller government and non-profit contributions to recreation and culture expenditures as well as miscellaneous goods and services (including social protection). All the smaller categories of household final consumption, except other services, were made entirely by households. The other service category includes services offered by political parties, labour, professional, environmental protection organizations, and religious groups with expenditures only made by the non-profit sector.
Nova Scotia's actual consumption expenditure growth accelerated from 2016-2019 before declining during the first waves of COVID-19 in 2020. In 2021, final actual consumption expenditure per capita at $45,321 is 4.7% higher than the 2019 level.
Non-market expenditures that benefit households fall into a few different categories: health, education, recreation/culture, housing, miscellaneous goods and services (including social protection), and other services.
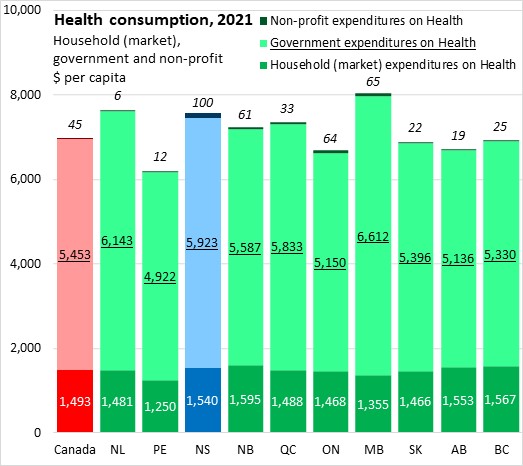
The largest non-market expenditures that benefit households were government expenditures on health. Health spending by governments is considerably larger than private, market-based expenditures on health care for households.
Nova Scotia's government expenditure for household health amounted to $5,923 per capita in 2021 - third highest in the country after Manitoba at $6,612 and Newfoundland and Labrador at $6,143. Nationally government health expenditures for households were $5,453 per capita. The lowest government expenditures for household health were in Prince Edward Island at $4,922 per capita.
Non-profit expenditures on health for households were at $100 per capita, highest among the provinces. National non-profit health expenditures for households were $45 per capita in 2021 (lowest: Newfoundland and Labrador)
Combining market, government and non-profit health expenditures for households, Nova Scotia had the third highest household health expenditures per capita with Manitoba the highest and Prince Edward Island the lowest.
Education expenditures were the second largest category of non-market spending that benefitted households. Nova Scotia's government education expenditures for households were $2,924 per capita (considerably larger than the $536 per capita in market expenditures). National government education expenditures for households were $2,907 per capita with a high of $3,916 in Saskatchewan and a low of $2,546 in British Columbia.
As with health care, non-profit education expenditures for households were smaller at $91 per capita nationally and $53 per capita in Nova Scotia.
Household actual final consumption on education (funded by all sources) were highest in Saskatchewan and lowest in New Brunswick.

The next three largest categories of non-market expenditures for households were miscellaneous (including social protection), other services, recreation/culture and housing/utilities.
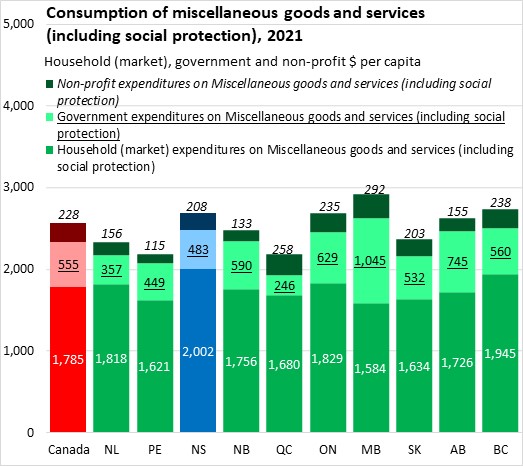
Government expenditures on miscellaneous/social protection amounted to $483 per capita in Nova Scotia in 2021 ($555 per capita nationally) while non-profit expenditures amounted to $208 per capita in 2021 ($228 per capita nationally).
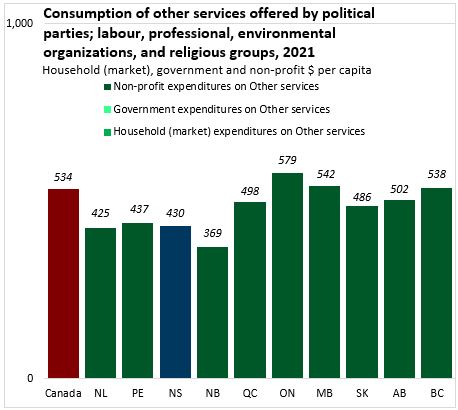
Other services offered by non-profit sector amounted to $430 per capita in Nova Scotia and $534 per capita in Canada in 2021. The consumption of ther services offered by political parties, labour, professional, environmental protection organizations, and religious groups was highest in Ontario ($579 per capita) and lowest in New Brunswick ($369 per capita).
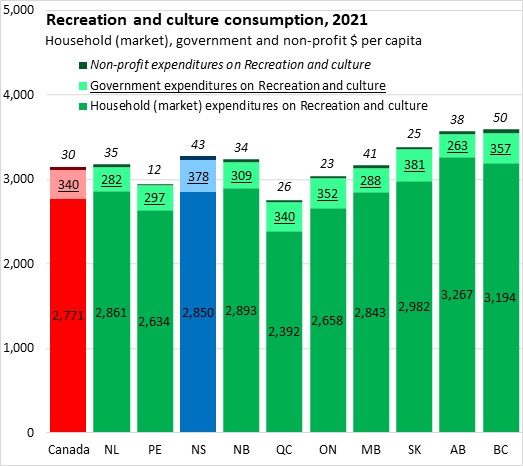
Recreation and culture expenditures by governments for households amounted to $378 per capita in Nova Scotia in 2021; non-profit expenditures were $43 per capita. These were considerably less than the $2,850 in household expenditures in the market for recreation and culture. Nationally, government recreation and culture expenditures for households were $340 per capita; non-profit expenditures were $30 per capita and private market expenditures were $2,771.
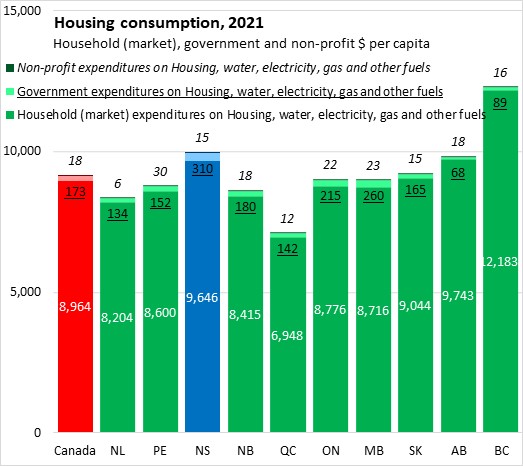
Housing consumption expenditures (including water and energy) were overwhelmingly private market expenditures in 2021 - ranging from $6,948 per capita in Quebec to $12,183 per capita in British Columbia. Nova Scotia household market spending on housing/utilities was $9,646 per capita, which were the third highest after British Columbia and Alberta. Government housing/utilities expenditures for households was $310 per capita in Nova Scotia in 2021 ($173 per capita nationally). Non-profit housing/utilities expenditures for households were $15 per capita in Nova Scotia in 2021 ($18 per capita nationally).
Notes: Household actual final consumption consists of the consumption of goods and services by households. The value of household actual final consumption is given by summing the following three components:
- The value of household expenditures on consumption of goods or services including expenditures on non-market good or services sold at prices that are not economically significant
- The value of the expenditures incurred by government units on individual consumption of goods or services provided to households as social transfers in kind
- The value of the expenditures incurred by non-profit institutions serving households on individual consumption of goods or services provided to households as social transfers in kind.
Source: Statistics Canada. Table 17-10-0005-01 Population estimates on July 1st, by age and sex; Table 36-10-0609-01 Household actual final consumption, Canada, provincial and territorial, annual (x 1,000,000)
<--- Return to Archive