The Economics and Statistics Division maintains archives of previous publications for accountability purposes, but makes no updates to keep these documents current with the latest data revisions from Statistics Canada. As a result, information in older documents may not be accurate. Please exercise caution when referring to older documents. For the latest information and historical data, please contact the individual listed to the right.
<--- Return to Archive
For additional information relating to this article, please contact:
March 22, 2023NOVA SCOTIA QUARTERLY POPULATION ESTIMATES AS OF JANUARY 1, 2023 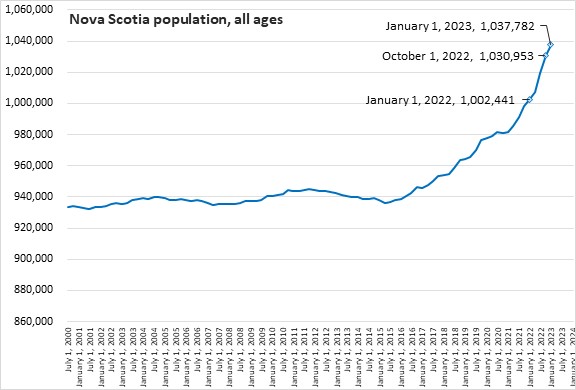
Nova Scotia's population was 1,037,782 as of January 1, 2023. This continues Nova Scotia's population growth - rising by 6,829 (+0.66%) from October 1, 2022.
Compared with January 1, 2022, Nova Scotia's population increased by 35,341 (+3.53%).
Since ending a period of population decline on April 1, 2015 Nova Scotia's population has increased by 101,511
Nova Scotia's population growth this quarter reflected a large increase non-permanent residents as well as positive contributions from immigration and interprovincial migration. Natural population change (births less deaths) continues to draw Nova Scotia's population down.
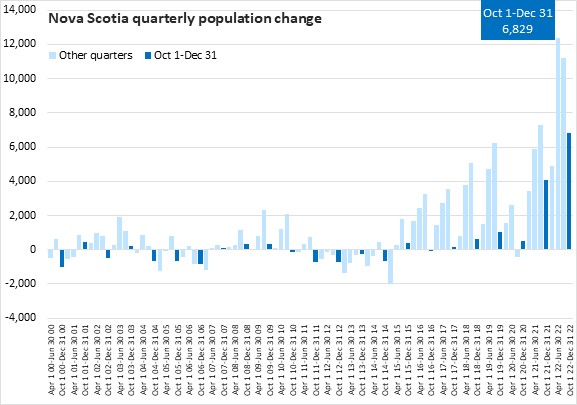
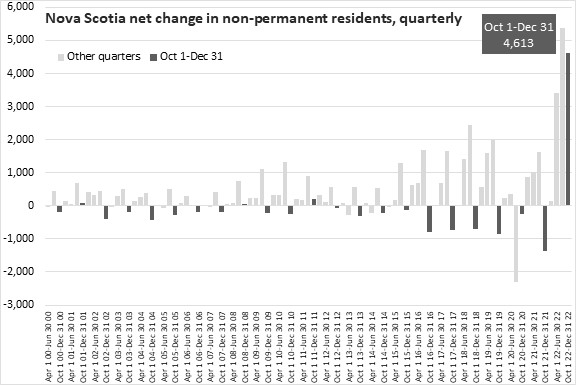
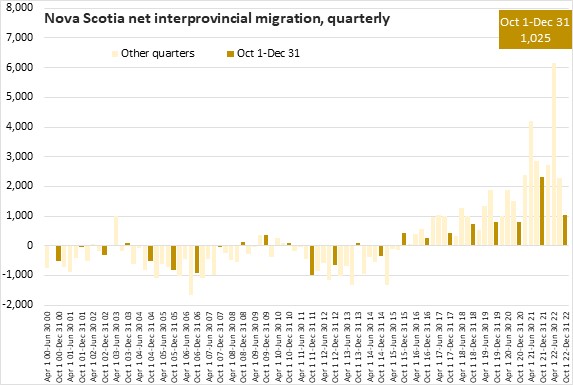
There are seasonal patterns in quarterly population changes, particularly evident in births and migration. From October 1 to December 31, 2022, Nova Scotia posted an increase well above any other recent Q4 change.
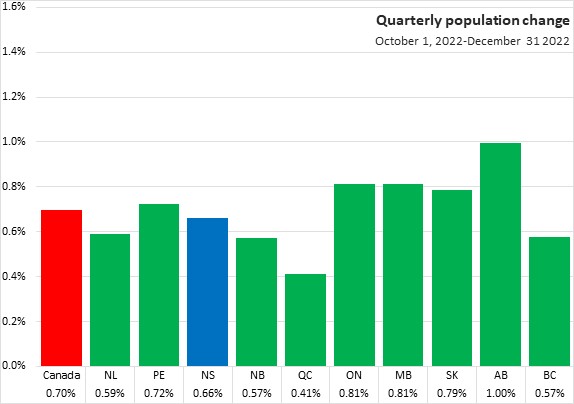
From October 1, 2022 to December 31, 2022 Nova Scotia’s population increased 0.66%, while the national population grew 0.70%. Alberta had the fastest growth over this period and Quebec had the slowest.
Compared with January 1, 2022 Nova Scotia’s population increased 3.53%, while the national population grew by 2.73%. Nova Scotia's population growth over this period was the third fastest among the provinces. Prince Edward Island (+4.25%) had the fastest growth over past year while the slowest was in Quebec (+1.74%).

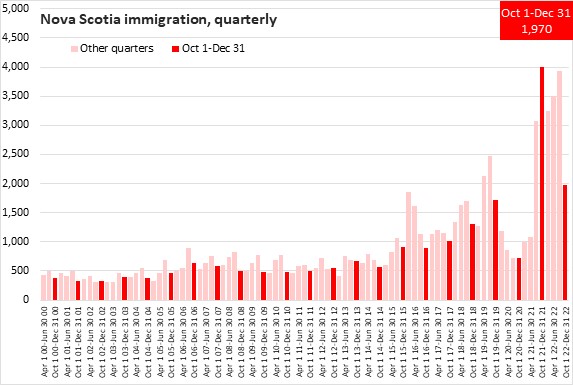
Immigration from other countries has been a strong contributor to population growth in Nova Scotia in recent years. While immigration slowed during periods of border restrictions over the course of the COVID-19 pandemic, there was a strong resurgence of immigration since July 1, 2021. Immigration to the province was 1,970 in the latest quarter. This is a smaller increase than any of the previous five quarters.
The net change in non-permanent residents in the province was an inflow of 4,613 from October 1 to December 31. This was the second largest increase for net non-permanent residents for any recent quarter.
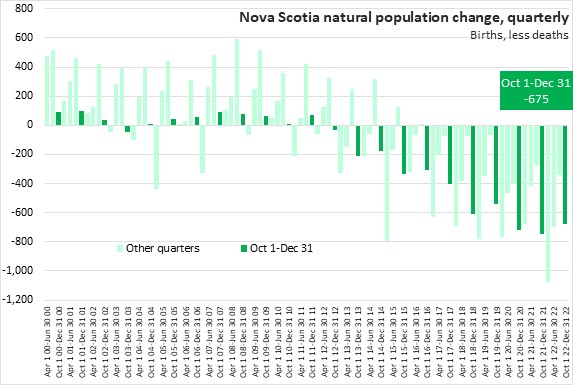
Nova Scotia’s natural population change (the number of births less the number of deaths) has been negative for several years. Between October 1 and December 31 there were 2,045 births and 2,720 deaths, amounting to a natural population decline of 675. The 2,045 births in Q4 2022 was the largest number of births for a Q4 period since 2015.
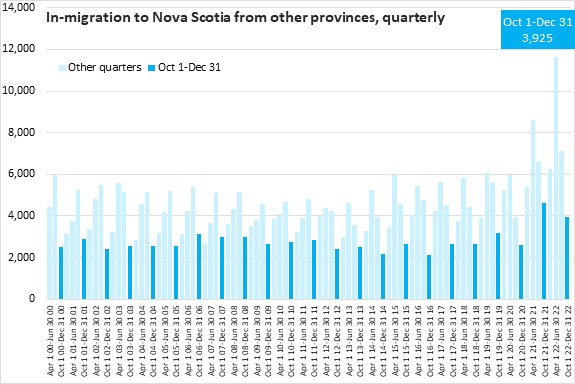
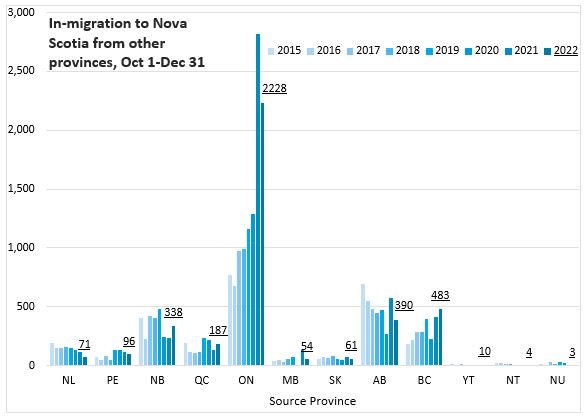
A total of 3,925 new Nova Scotians arrived in the province from other parts of Canada from October 1 to December 31. In-migration in the fourth quarter in 2022 was larger than the same period in previous years except for 2021.
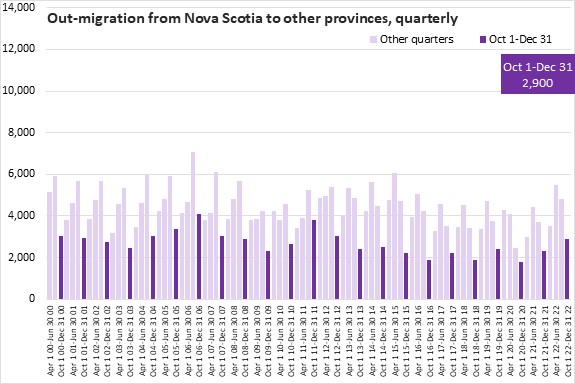
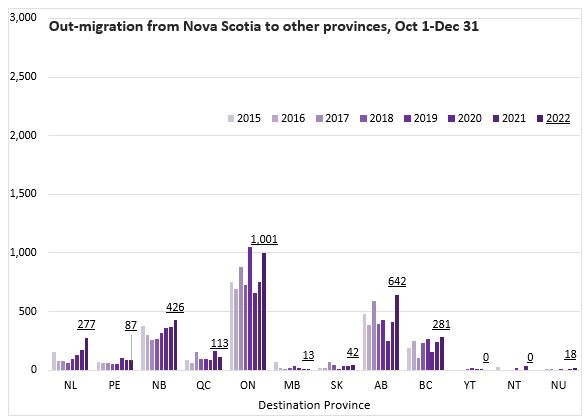
A total of 2,900 Nova Scotians left the province bound for other parts of Canada from October 1 to December 31.
The net change in Nova Scotia's population from interprovincial migration was a gain of 1,025 from October 1 to December 31. A significant slowing from previous seven quarters pace.
The number of in-migrants to Nova Scotia from October 1 to December 31, 2022 decreased by 708 from the same period in 2021. There were notable decreases of in-migrants from Ontario from 2,820 in Q4 2021 to 2,228 in Q4 2022. In-migrants from New Brunswick, British Columbia, and Quebec were up compared to Q4 2021.
Out-migration from Nova Scotia to other provinces increased by 596 for October 1 to December 31 compared with the same period in 2021. Out-migration increased the most to Ontario and Alberta.
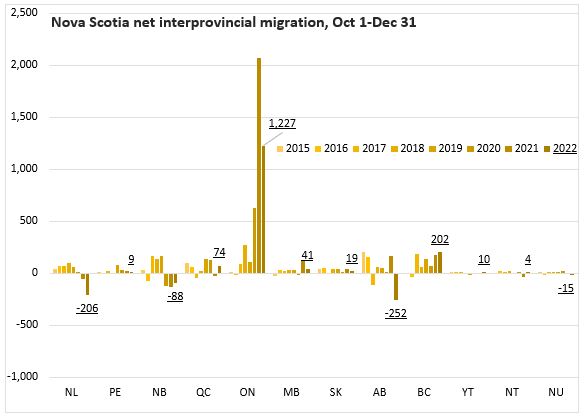
Comparing net interprovincial migration from October 1 to December 31, 2022 with the same period last year, overall net migration decreased by 1,304. The largest positive net migration continued to be with Ontario at 1,227 while the largest net negative migration was with Alberta at 252.
Source: Statistics Canada. Table 17-10-0009-01 Population estimates, quarterly; Table 17-10-0020-01 Estimates of the components of interprovincial migration, quarterly; Table 17-10-0040-01 Estimates of the components of international migration, quarterly; Table 17-10-0045-01 Estimates of interprovincial migrants by province or territory of origin and destination, quarterly; Table 17-10-0059-01 Estimates of the components of natural increase, quarterly
<--- Return to Archive