The Economics and Statistics Division maintains archives of previous publications for accountability purposes, but makes no updates to keep these documents current with the latest data revisions from Statistics Canada. As a result, information in older documents may not be accurate. Please exercise caution when referring to older documents. For the latest information and historical data, please contact the individual listed to the right.
<--- Return to Archive
For additional information relating to this article, please contact:
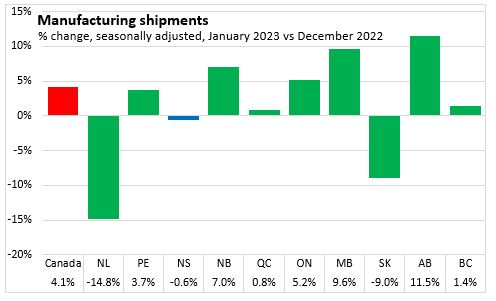
March 14, 2023MANUFACTURING SHIPMENTS, JANUARY 2023 Month over month (seasonally adjusted, January 2023 vs December 2022)
Nova Scotia's manufacturing shipments decreased 0.6% to $869 million. National shipments increased 4.1% to $73.9 billion. Manufacturing shipments were up in 7 of 10 provinces led by Alberta, Manitoba, and New Brunswick. Newfoundland and Labrador reported the largest decline.
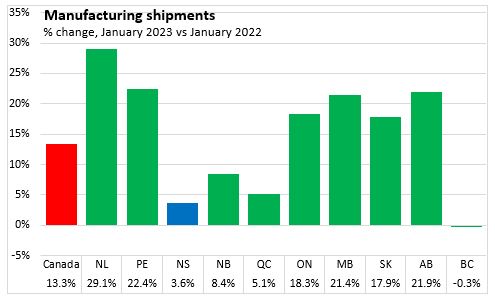
Year over year (January 2023 vs January 2022)
Nova Scotia's manufacturing shipments increased 3.6%. National shipments increased 13.3%.
Manufacturing shipments were up in 9 of 10 provinces, led by Newfoundland and Labrador. British Columbia reported a small decline.
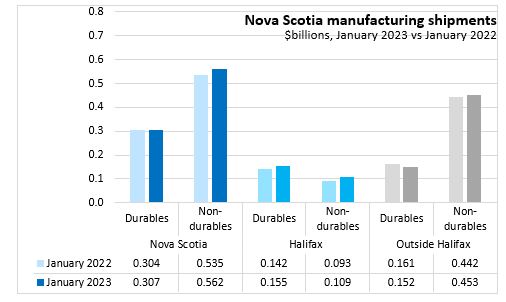
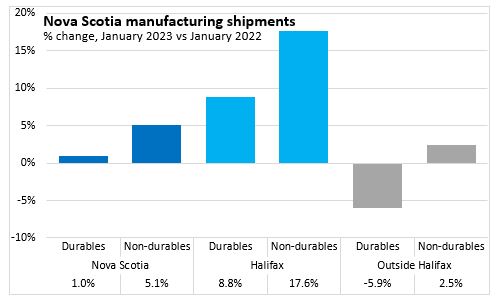
Nova Scotia's durable goods shipments increased 1,0%, while non-durable goods shipments increased 5.1%. In Halifax, durable goods shipments increased 8.8%, while non-durables increased 17.6%. Outside Halifax, durable goods shipments decreased 5.9%, while non-durables increased 2.5%.
Trends
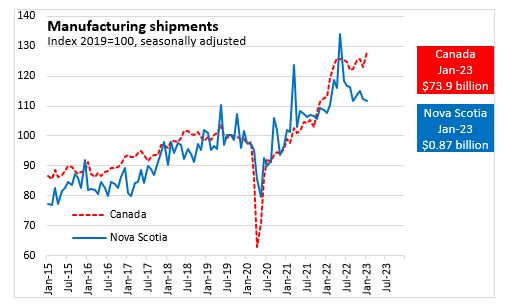
After reporting a large increased in May of 2022, Nova Scotia's seasonally adjusted manufacturing shipments have fallen back towards previous trends. Periodic spikes in Nova Scotia's shipments values are not uncommon. Throughout most of 2022, Nova Scotia's manufacturing shipments growth has lagged the national pace.
Statistics Canada. Table 16-10-0047-01 Manufacturers' sales, inventories, orders and inventory to sales ratios, by industry (dollars unless otherwise noted); Table 16-10-0048-01 Manufacturing sales by industry and province, monthly (dollars unless otherwise noted) (x 1,000); Table 16-10-0011-01 Manufacturing sales, by industry for 12 Selected Census Metropolitan Areas (x 1,000)
<--- Return to Archive