The Economics and Statistics Division maintains archives of previous publications for accountability purposes, but makes no updates to keep these documents current with the latest data revisions from Statistics Canada. As a result, information in older documents may not be accurate. Please exercise caution when referring to older documents. For the latest information and historical data, please contact the individual listed to the right.
<--- Return to Archive
For additional information relating to this article, please contact:
November 29, 2022AQUACULTURE, 2021 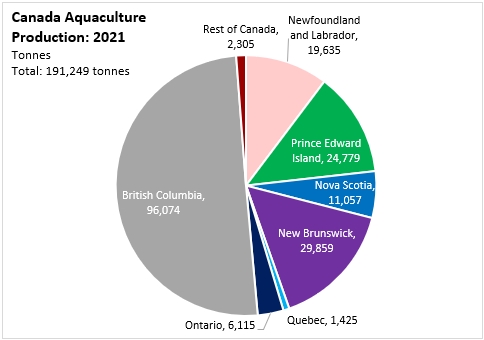
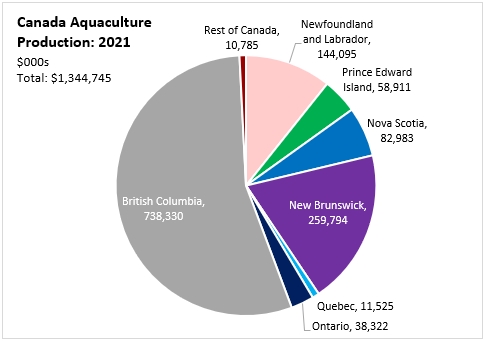
Canada's aquaculture industry produced 191,249 tonnes of finfish and shellfish products in 2021 (including restocking), with a value of $1.34 billion.
Aquaculture output tonnage increased by 11.7% from 2020 to 2021 with the largest gain among major aquaculture producers observed in Newfoundland and Labrador.
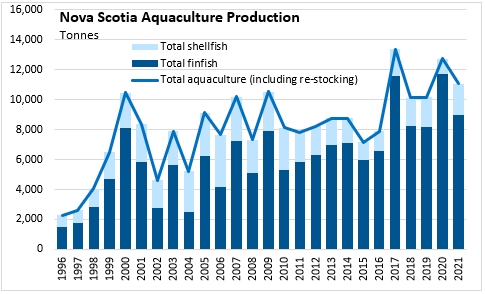
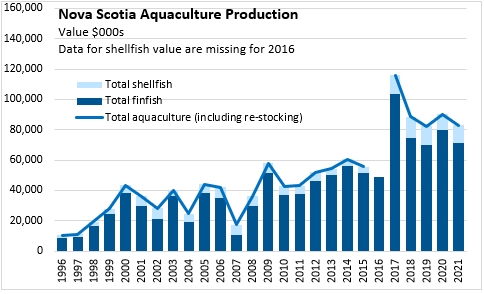
Nova Scotia was the only juristiction reporting a decline in aquaculture production tonnage, a decline of 13.1% to 11,057 tonnes in 2021. Nova Scotia's aquaculture output value fell by 8.0% to $83.0 million. Value per tonne of output from Nova Scotia's aquaculture industry increased by 5.9%.
By province, Canada's largest aquaculture producers are British Columbia and New Brunswick, which accounted for 65.8% of production volume and 74.2% of production value in 2021.
Nova Scotia produced 5.8% of the national aquaculture volume (in tonnes) in 2021 and 6.2% of the national value in dollars of aquaculture output. Nova Scotia is the fourth largest aquaculture producer by value and the fifth largest by volume.
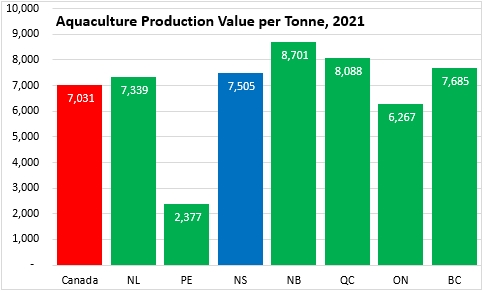
In 2021, the average unit value of Nova Scotia's aquaculture products was above the national average at $7,505 per tonne. This was up 5.9% from value per tonne in 2020. Quebec aquaculture had the highest value per tonne while Prince Edward Island had the lowest. This differences across provinces reflects in part differences in the relative amounts of finfish and shellfish produced in each province, with finfish generally having higher unit values.
Nova Scotia's aquaculture output volume was down in 2021 and has yet to recover to highs observed in 2018. The value of Nova Scotia’s aquaculture production declined in 2021 after a rebound in 2020.
Value Added
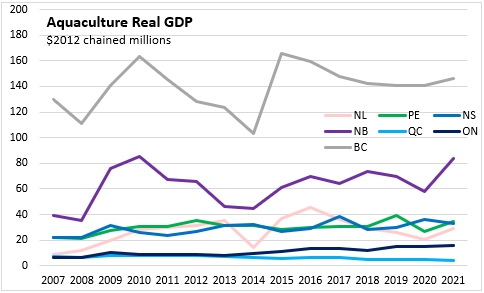
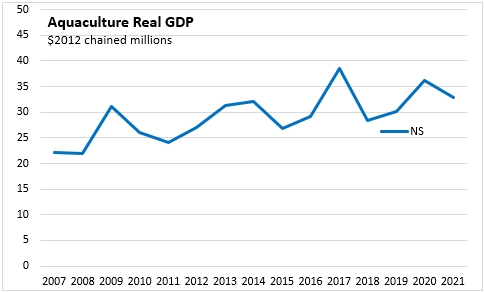
Real GDP in Nova Scotia's aquaculture industry declined 9.4% in 2021. Aquaculture real GDP was up in all provinces except Quebec and Nova Scotia.
British Columbia and New Brunswick generate the largest amount of real GDP from aquaculture. Nova Scotia, Newfoundland and Labrador and Prince Edward Island generate similar amounts of real GDP from aquaculture. Ontario's real GDP from aquaculture has been rising and is now above aquaculture GDP from Quebec.
Between 2007 and 2021, Nova Scotia's aquaculture real GDP has grown at an average annual pace of 2.9% per year. Newfoundland and Labrador's aquaculture real GDP grew the fastest over this period, rising by 9.0% per year. Real GDP from aquaculture grew more slowly over this period in British Columbia (0.9% per year).
Source: Statistics Canada. Table 32-10-0107-01 Aquaculture, production and value; Table 36-10-0402-01 Gross domestic product (GDP) at basic prices, by industry, provinces and territories (x 1,000,000)
<--- Return to Archive