The Economics and Statistics Division maintains archives of previous publications for accountability purposes, but makes no updates to keep these documents current with the latest data revisions from Statistics Canada. As a result, information in older documents may not be accurate. Please exercise caution when referring to older documents. For the latest information and historical data, please contact the individual listed to the right.
<--- Return to Archive
For additional information relating to this article, please contact:
October 27, 2022JOB VACANCIES, AUGUST 2022 Statistics Canada released today monthly results from the Job Vacancy and Wage Survey (JVWS) for August 2022, the data is not adjusted for seasonal patterns.
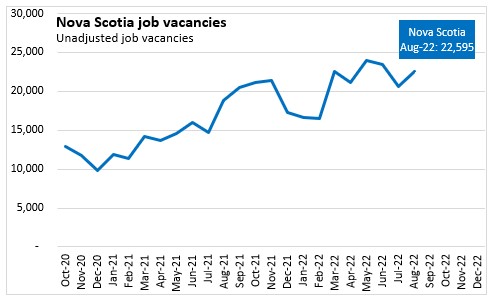
Nova Scotia had 22,595 job vacancies in August 2022 with a vacancy rate of 4.8%.
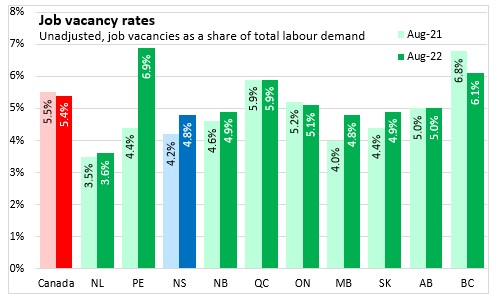
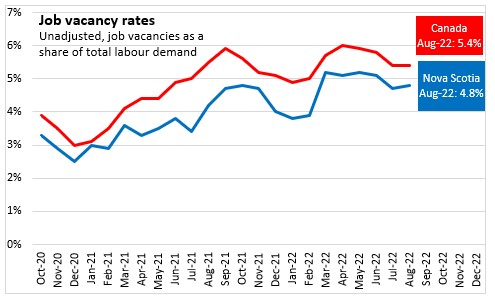
Canadian employers were actively recruiting for 958,480 positions in August with a vacancy rate of 5.4%.
The highest vacancy rate was reported in Prince Edward Island while the lowest vacancy rate was reported in Newfoundland and Labrador.
Although there are seasonal variations, Nova Scotia's job vacancy rates have been trending up since the start of 2021. Following two consecutive months of declines, Nova Scotia's job vacancy rate edged up slightly in July.
The number of job vacancies in Nova Scotia reached 22,595 in August 2022. In August 2021, there were 18,815 vacancies.
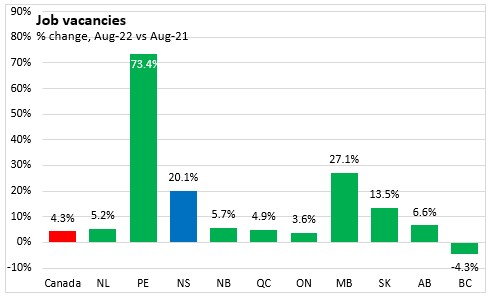
Comparing August 2022 August 2021, the number of job vacancies in Nova Scotia was up 20.1%. This was the third largest growth among the provinces following Prince Edward Island (+73.4%) and Manitoba (+27.1%). National job vacancy increased 4.3% over the same period. Only British Columbia reported lower job vacancies.
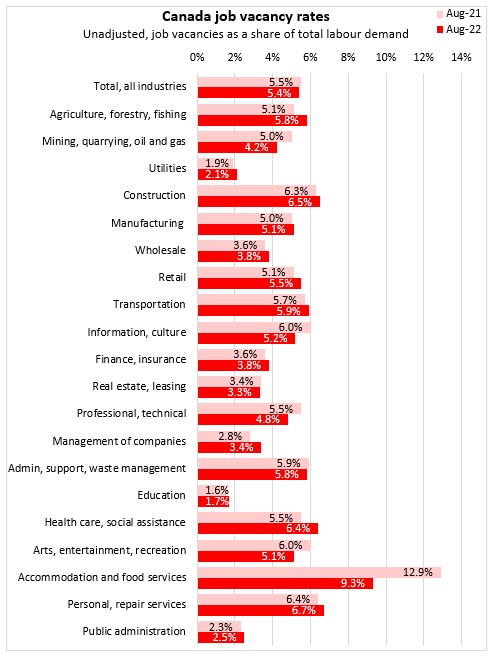
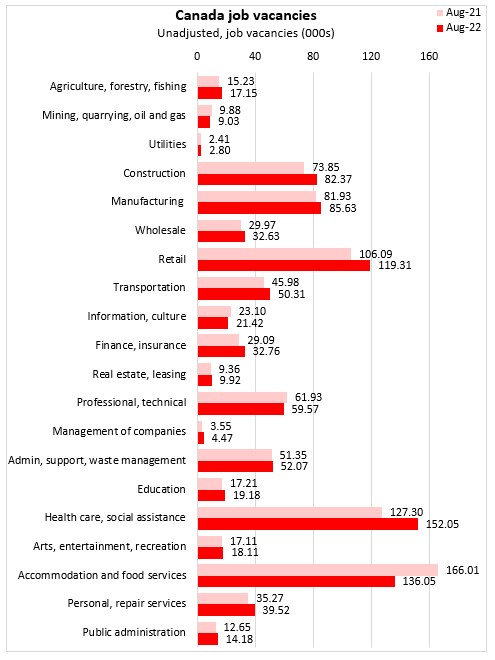
Nationally, the accommodation and food services sector had the highest job vacancy rate (9.3%) and the second highest number of job vacancies at 136,050. This industry has had the highest vacancy rate among all industries for over a year.
After accommodation and food services, the next highest job vacancy rates in Canada were reported in construction, personal and repair services and health care and social assistance. The lowest vacancy rates were in education and public administration.
Health care and social assistance had the highest number of vacancies at 152,045 in August. Both the number of vacancies and the job vacancy rate (6.4%) reached a record high in health care and social assistance in August.
Notes: The job vacancy rate is the percentage of job positions (both filled and vacant) that are vacant. A higher job vacancy rate indicates a tighter labour market where it is more difficult for employers to find suitable candidates for the positions offered. A lower job vacancy rate signals labour market slack and potentially more job seekers competing for each vacant position.
Information on monthly job vacancies will continue in future Statistics Canada releases, and a more detailed analysis will be released with quarterly estimates from the Job Vacancy and Wage Survey.
Sources: Statistics Canada, Table 14-10-0371-01 Job vacancies, payroll employees, and job vacancy rate by provinces and territories, monthly, unadjusted for seasonality; Table 14-10-0372-01 Job vacancies, payroll employees, and job vacancy rate by industry sector, monthly, unadjusted for seasonality
<--- Return to Archive