The Economics and Statistics Division maintains archives of previous publications for accountability purposes, but makes no updates to keep these documents current with the latest data revisions from Statistics Canada. As a result, information in older documents may not be accurate. Please exercise caution when referring to older documents. For the latest information and historical data, please contact the individual listed to the right.
<--- Return to Archive
For additional information relating to this article, please contact:
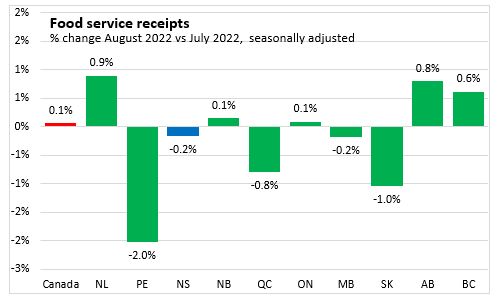
October 27, 2022FOOD SERVICES AND DRINKING PLACES, AUGUST 2022 Month-over-Month (August 2022 vs July 2022, seasonally adjusted)
Nova Scotia food services and drinking places receipts decreased 0.2% to $170.5 million. Canada's food services and drinking places receipts grew 0.1% to $7.1 billion. Five provinces reported monthly increases in receipts for food services and drinking places, with Newfoundland and Labrador reporting the largest gain. Prince Edward Island reporting the largest decline.
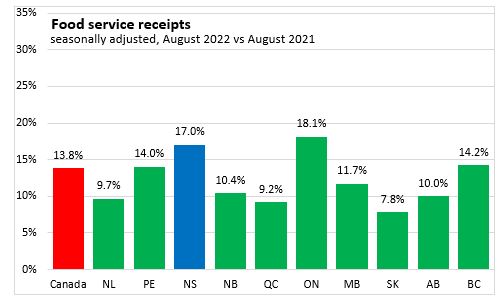
Year-over-year (August 2022 vs August 2021)
Nova Scotia food services and drinking places receipts increased 17.0% from August 2021. Canada's food services and drinking places receipts increased 13.8%. All provinces reported year-over-year increases in food services and drinking place receipts, with Ontario and Nova Scotia reporting the largest gains. Saskatchewan reported the smallest gains.
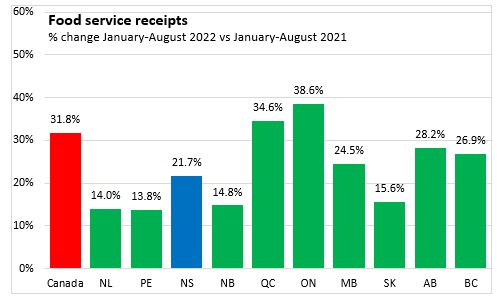
Year-to-date (Jan-Aug 2022 vs Jan-Aug 2021)
Nova Scotia food services and drinking places receipts increased 21.7%. Canada's food services and drinking places receipts increased 31.8%. All provinces reported year-to-date increases in food services and drinking place receipts, with Ontario and Quebec reporting the largest gains and Prince Edward Island reporting the smallest gain.
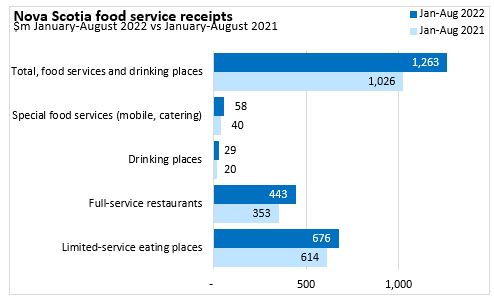
In unadjusted results by category, Nova Scotia's gains in food service and drinking place receipts were most pronounced for lfull service restaurants, in dollar terms. In percentage terms, the increases were highest for drinking places.

Trends
Food services and drinking places have reported repeated downturns during imposition of COVID restrictions. As these restrictions eased, food service receipts rebounded.

Source: Statistics Canada. Table 21-10-0019-01 Monthly survey of food services and drinking places (x 1,000)
<--- Return to Archive