The Economics and Statistics Division maintains archives of previous publications for accountability purposes, but makes no updates to keep these documents current with the latest data revisions from Statistics Canada. As a result, information in older documents may not be accurate. Please exercise caution when referring to older documents. For the latest information and historical data, please contact the individual listed to the right.
<--- Return to Archive
For additional information relating to this article, please contact:
October 26, 2022CENSUS: IMMIGRATION, RACIALIZED GROUPS, ETHNIC/CULTURAL ORIGIN, RELIGION Results from the 2021 Census illustrate the changing composition of Canada's population, including the increasing share of the population who immigrated to Canada.
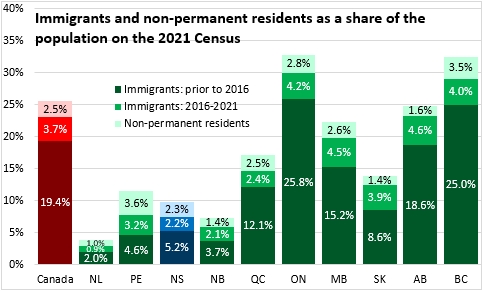
Immigrants accounted for just over 23% of Canada's population in the 2021 Census, along with a further 2.5% of the population who were non-permanent residents (such as international students or temporary foreign workers). In Nova Scotia, immigrants made up 7.4% of the population, including 2.2% who arrived in the previous 5 years. Non-permanent residents made up a further 2.3% of Nova Scotia's population in 2021.
The share of immigrants and non-permanent residents was highest in Ontario and British Columbia and lowest in Newfoundland and Labrador.
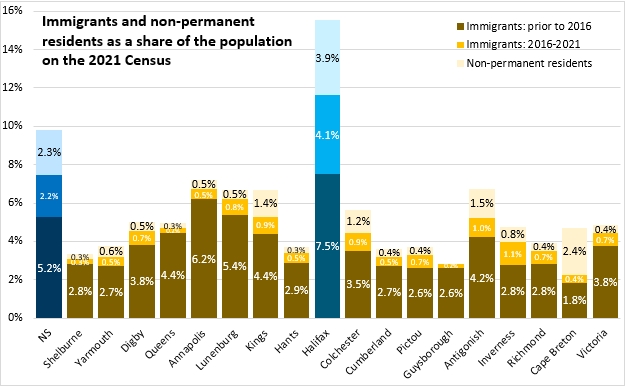
Immigrants and non-permanent are most heavily concentrated in Halifax. Cape Breton County reported the lowest share of immigrants, but the second highest share of non-permanent residents.
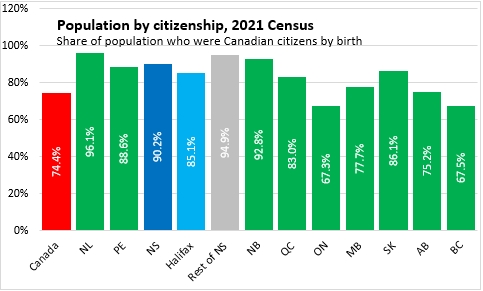
In Nova Scotia, 90.2% of the population were Canadian citizens by birth. This was lower in Halifax (85.1%) and higher in the rest of the province (94.9%). Nationally, 74.4% of the population were Canadian citizens by birth with the highest share in Newfoundland and Labrador and the lowest shares in Ontario and British Columbia.
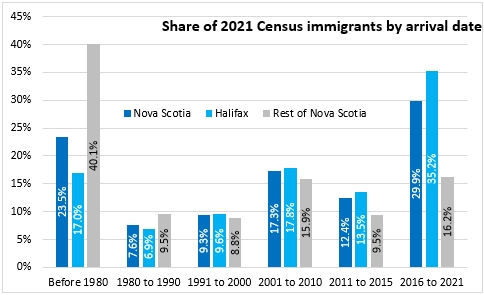
Almost 30% of Nova Scotia's immigrant population arrived in the 5 years prior to the Census (2016-2021). This number was notably higher for Halifax (35.2%) and lower for the rest of the province (16.2%). A much larger portion of the immigrants residing outside Halifax arrived prior to 1980 (40.1%).
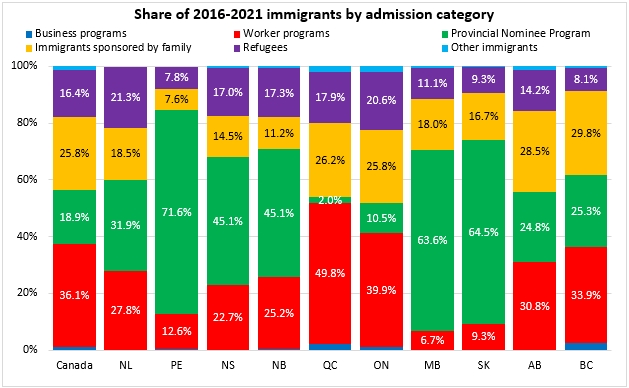
The provincial nominee program accounted for the largest portion of immigration admissions in Nova Scotia. This was the largest immigration admission category in all Atlantic provinces as well as in Saskatchewan and Manitoba. In larger, urban provinces (Ontario, Quebec, Alberta, British Columbia), worker programs account for the largest portion of immigrant admissions.
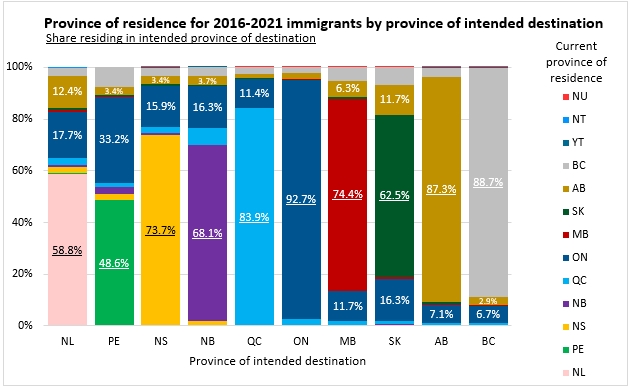
Looking at the population of immigrants that arrived from 2016-2021, 73.7% resided in Nova Scotia in 2021. Larger urban provinces (Ontario, Quebec, Alberta, British Columbia) reported the highest portions of immigrants who remained in their intended destination. Prince Edward Island reported the lowest portion of immigrants that continued to reside in their intended province of destination. Among those who no longer reside in their intended province of destination, Ontario accounted for the largest share for every other province.
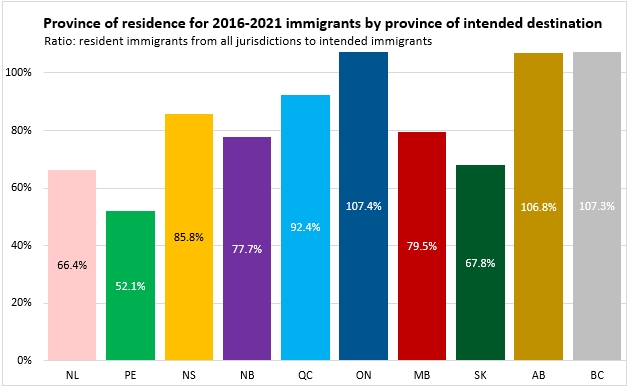
Counting both immigrants who remained in their intended province of destination plus those who moved to the province after arrival ('resident immigrants'), the ratio of resident immigrants to intended immigrants was 85.8% in Nova Scotia, the highest outside the larger urban provinces.
Racialized groups
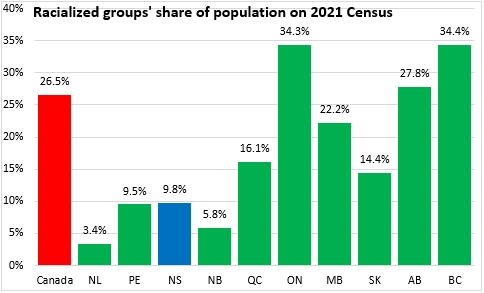
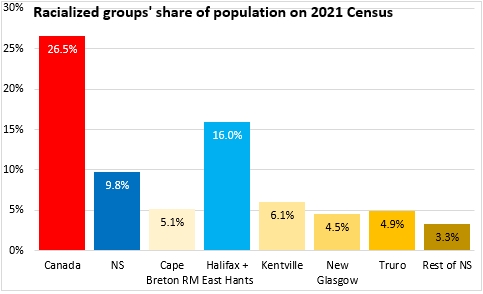
Respondents to the 2021 Census were asked whether they identified with specific categories of visible minority. These racialized groups accounted for 9.8% of the population in Nova Scotia. Nationally racialized persons made up 26.5% of the population and over one-third of the populations of Ontario and British Columbia. The portion of racialized persons in the population was lowest in Newfoundland and Labrador.
Across Nova Scotia, the portion of racialized persons in the population was notably higher in Halifax (16.0%, note that Statistics Canada's Census Metropolitan Area for Halifax now includes East Hants) and lower across the rest of the province.
Nova Scotians that identified as Black made up the largest population in a racialized group in Nova Scotia (28,220). This was followed by those who identified as South Asian (21,655), those who identified as Chinese (11,600), those who identified as Arab (10,610) and those who identified as Filipino (6,615).
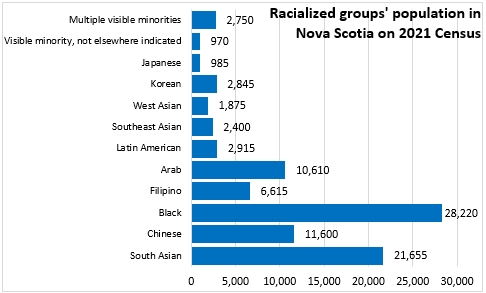
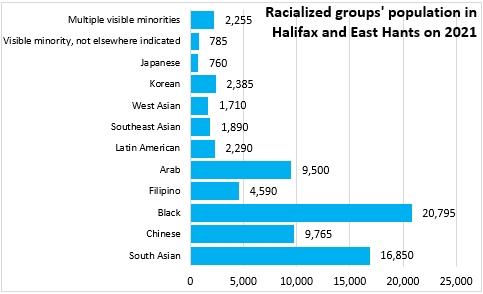
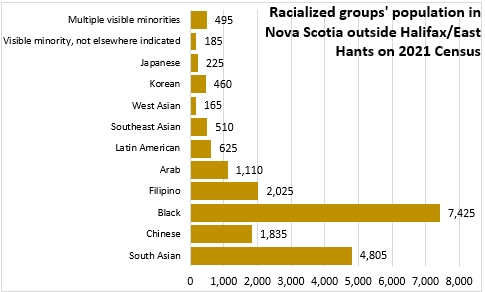
The Halifax/East Hants Census Metropolitan Area were home to the bulk of racialized populations in Nova Scotia.
Ethnic and cultural origins
Canadians were asked on the 2021 Census to identify their ethnic or cultural origins. Residents could identify any origin and could identify multiple origins (so portions will not sum to 100%).
European and 'North American' (non-Indigenous) were the most widely cited ethnic and cultural origins in Nova Scotia.

In Yarmouth, Digby and Richmond Counties, Acadian was a commonly-cited 'other North American' ethnic/cultural origin.
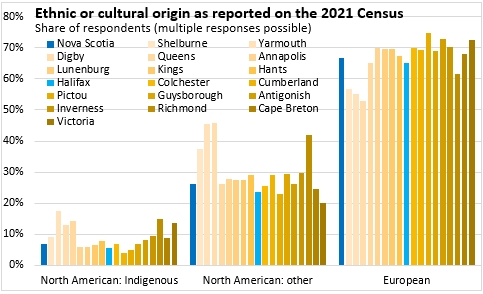
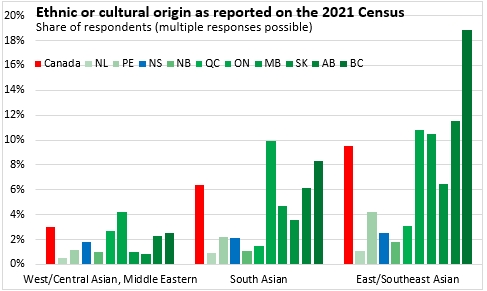
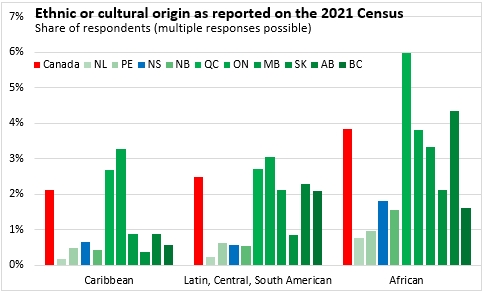
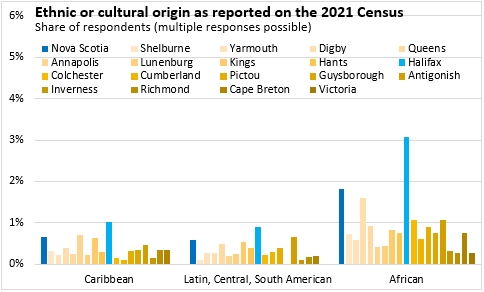
East/Southeast Asian, South Asian, African and West/Central Asian or Middle Eastern were the next most commonly cited ethnic or cultural origins in Nova Scotia, but each amounted to less than 3% of respondents. However, Halifax residents reported notable higher shares of these ethnic and cultural origins.

Religion
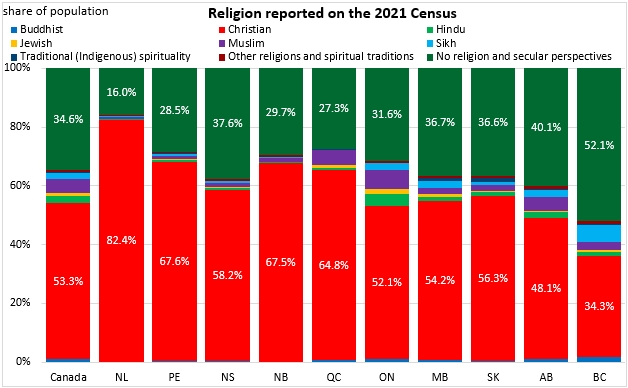
Canadians are asked about religion on every second Census. In 2021, 58.2% of Nova Scotians identified as Christian while 37.6% cited no religion or a secular perspective. Across Canada, just over 53% of the population identified as Christian while over one-third reported no religion or a secular perspective. Christianity was most the commonly identified religion in Newfoundland and Labrador. In British Columbia, over half the population cited no religion or a secular perspective. Ontario and British Columbia reported the highest population shares with non-Christian religious identification.
Source: Statistics Canada. Table 98-10-0302-01 Immigrant status and period of immigration by place of birth and citizenship: Canada, provinces and territories and census metropolitan areas with parts; Table 98-10-0305-01 Province or territory of intended destination by admission category and immigrant status and period of immigration: Canada, provinces and territories, census metropolitan areas and census agglomerations with parts; Table 98-10-0337-01 Visible minority by ethnic or cultural origin: Canada, provinces and territories, census metropolitan areas and census agglomerations with parts; Table 98-10-0343-01 Religion by immigrant status and period of immigration and place of birth: Canada, provinces and territories
<--- Return to Archive