The Economics and Statistics Division maintains archives of previous publications for accountability purposes, but makes no updates to keep these documents current with the latest data revisions from Statistics Canada. As a result, information in older documents may not be accurate. Please exercise caution when referring to older documents. For the latest information and historical data, please contact the individual listed to the right.
<--- Return to Archive
For additional information relating to this article, please contact:
September 09, 2022LABOUR MARKET TRENDS, AUGUST 2022 Labour force survey results reflect the period from August 14-20.
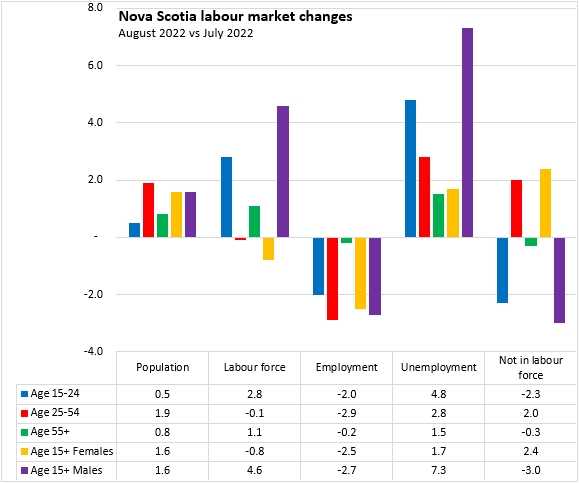
Ages 15+ (August 2022 vs July 2022, seasonally adjusted)
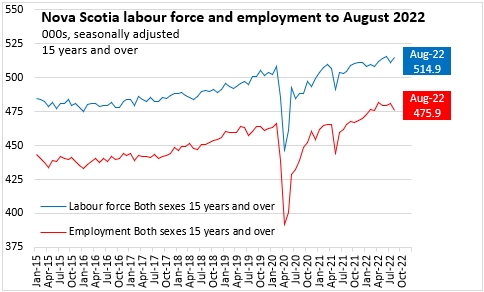
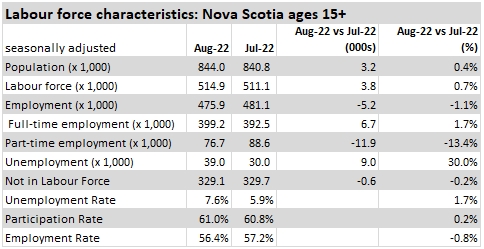
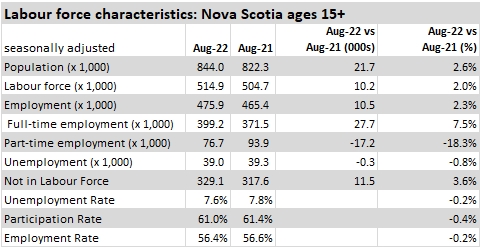
Nova Scotia's seasonally adjusted employment decreased 5,200 (-1.1%) from July 2022, falling to 475,900 in August 2022.
The change in employment was attributable to a large decline in part-time employment (-11,900) offset by a smaller gain in full-time employment (+6,700). These changes include variations in hours within the same job.
Nova Scotia’s labour force increased by 3,800 (+0.7%) to 514,900 in August 2022, rebounding after falling last month.
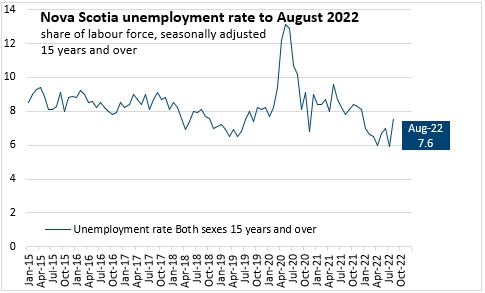
With falling employment and rising labour force, Nova Scotia's unemployment rate increased from a monthly low of 5.9% in July 2022 to 7.6% in August 2022.
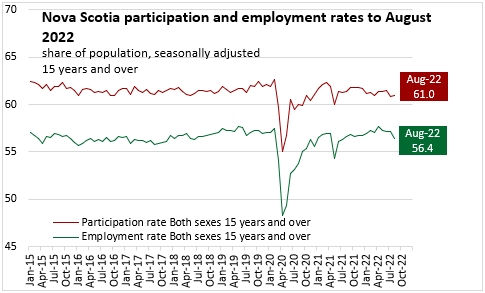
Nova Scotia's labour force participation rate was up 0.2 percentage points to 61.0% in August 2022. The employment rate was down 0.8 percentage points to 56.4% in August 2022.
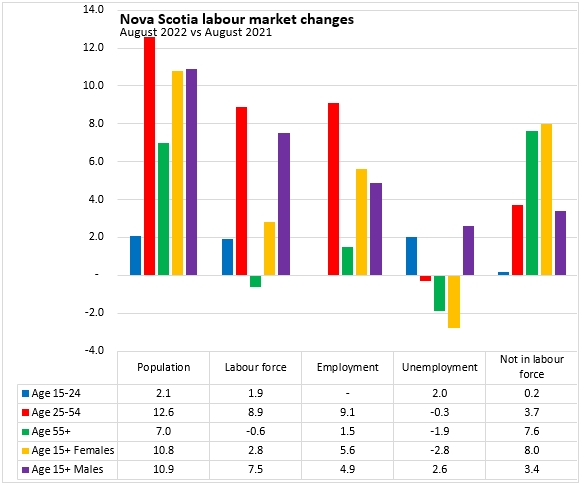
Ages 15+ (August 2022 vs August 2021, seasonally adjusted)
Compared with August of 2021, Nova Scotia's population over the age of 15 had increased by 21,700 (+2.6%) while the labour force grew by 10,200 (+2.0%) and employment increased by 10,500 (+2.3%). The unemployment rate decreased by 0.2 percentage points while the participation rate fell by 0.4 percentage points. The employment rate decreased by 0.2 percentage points.
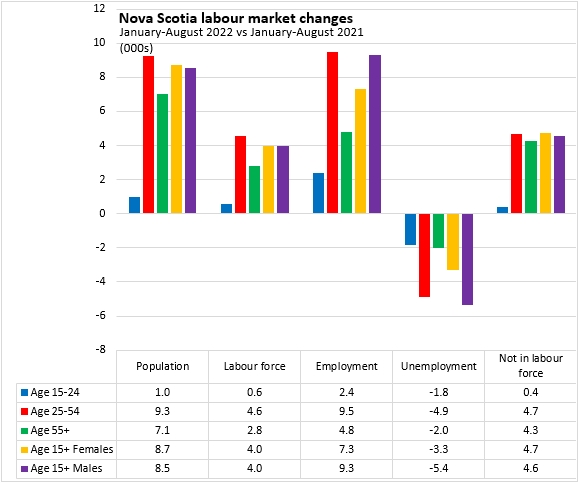
Ages 15+ (January-August 2022 vs January-August 2021, seasonally adjusted)
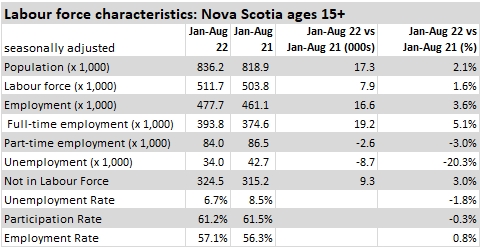
Compared with the first eight months of 2021, Nova Scotia's population has averaged 17,300 (+2.1%) higher for January to August of 2022. The labour force was up by 7,900 (+1.6%)and employment increased by 19,200 (+5.1%). The unemployment rate decreased by 1.8 percentage points to 6.7% on average in the first eight months of 2022. The year-to-date average participation rate declined by 0.3 percentage points to 61.2%. The employment rate increased by 0.8 percentage points to 57.1% year-to-date.
Age Cohorts (August 2022 vs July 2022, seasonally adjusted)
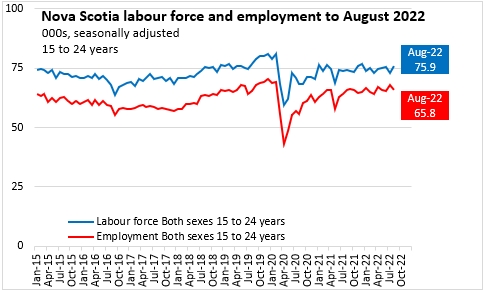
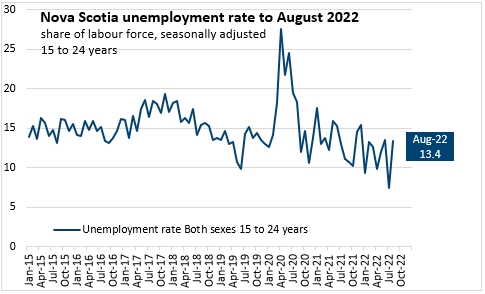
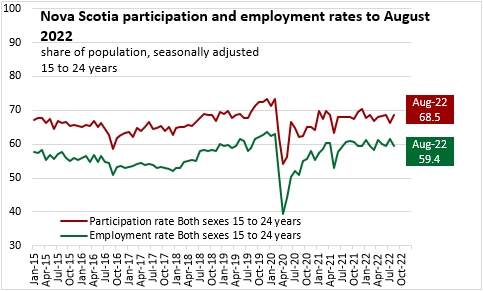
Among youth (ages 15-24), employment fell by 2,000 (-2.9%) while the labour force increased by 2,800 (+3.8%). Because employment decreased while labour force grew, the youth unemployment rate increased from a monthly low of 7.4% in July to 13.4% in August. The rise in the youth labour force caused the youth participation rate to rebound by 2.2 percentage points to 68.5% while the fall in employment reduced youth employment rates 2.1 percentage points to 59.4%.
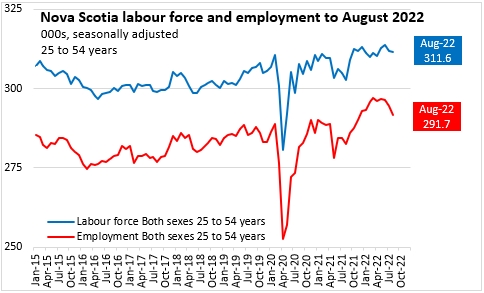
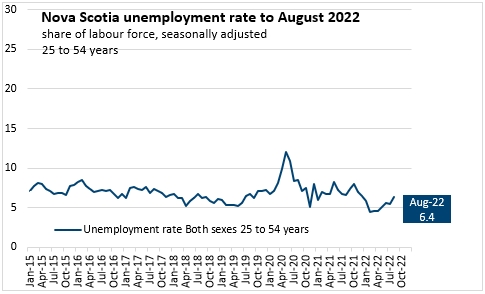
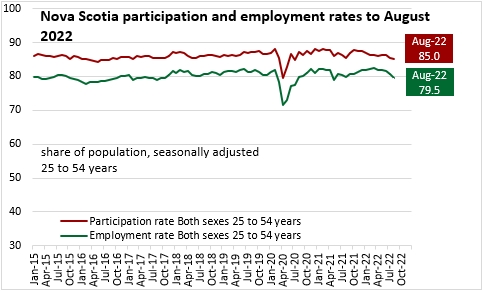
The population aged 25-54 makes up the largest part of the labour force. In the core age group, employment decreased by 2,900 (-1.0%) and the labour force declined by 100 (-0.03%). Because employment declined while the labour force was stable, the core aged unemployment rate increased 0.9 percentage points to 6.4% in August. The core aged participation rate fell by 0.4 percentage points to 85.0% while the core aged employment rate decreased 1.3 percentage points to 79.5%.
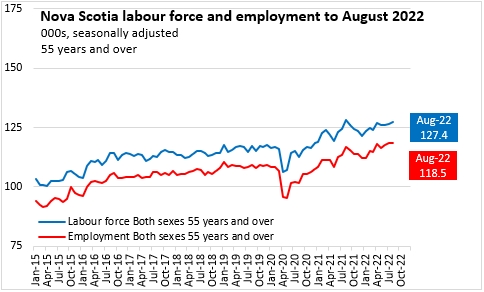
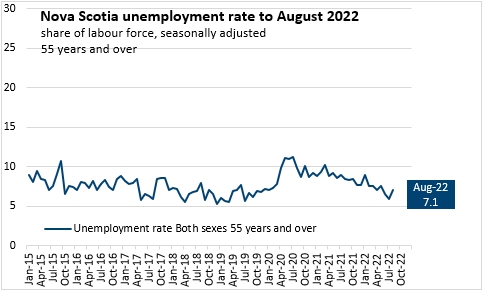
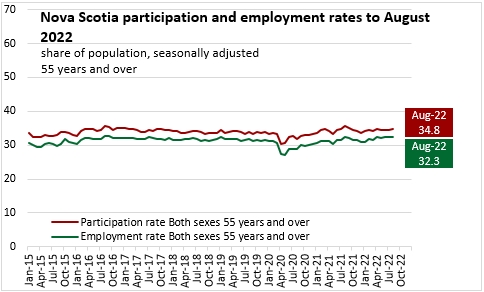
Older workers (aged 55+) reported an increase for in labour force (+1,100 or +0.9%) while employment edged down (-200 or -0.2%). With rising labour force and a slight decline in employment, the older worker unemployment rate increased by 1.2 percentage points to 7.1%. The older worker participation rate was up 0.3 percentage points to 34.8% and the employment rate for older workers decreased 0.3 percentage points to 32.3%.
Males and Females (Ages 15+, July 2022 vs June 2022, seasonally adjusted)
Monthly employment was down for both females (-2,500 or -1.0%) and for males (-2,700 or -1.1%). However, there was a notable rebound in male labour force (+4,600 or +1.8%) after a sizable contraction in the previous month. Female labour force fell by 800 (-0.3%) from July to August 2022.

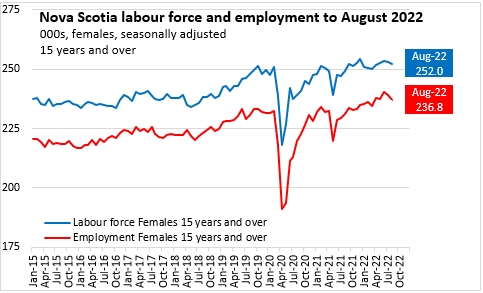
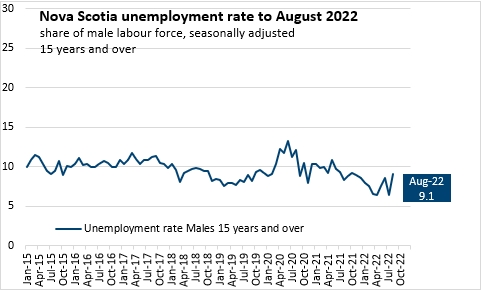
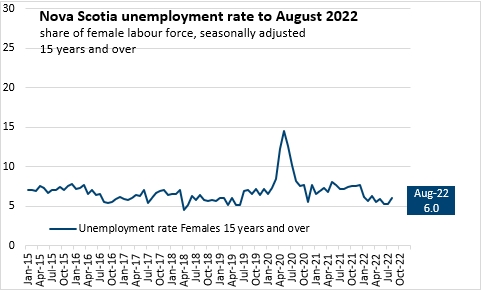
With a decline in employment and a sharp increase in labour force the male unemployment rate increased by 2.7 percentage points to 9.1% in August. The female unemployment rate was up 0.7 percentage points to 6.0% because the decline in employment was faster than the drop in labour force.
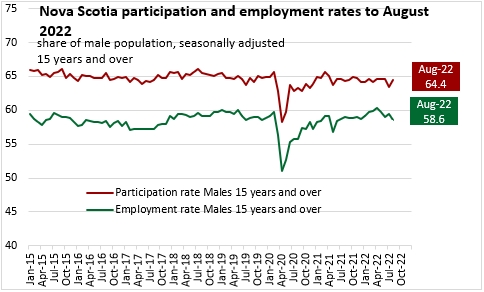
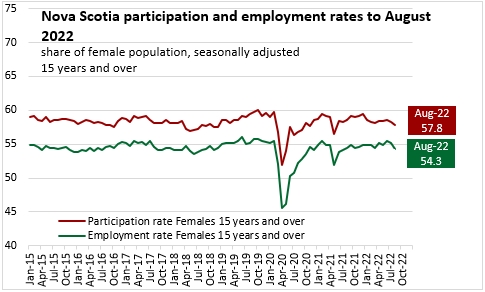
Male participation rates rebounded by 0.9 percentage points to 64.4% while female participation rates were down 0.4 percentage points to 57.8%. Male employment rates were down 0.9 percentage points to 58.6% while female employment rates fell 0.8 percentage points to 54.3%.
Overall, last month's employment declines were spread across all cohorts except older workers. The rise in labour force was more concentrated among males as well as among youth and older workers.
Age and sex cohorts (August 2022 vs August 2021, seasonally adjusted)
Compared with August 2021, the latest month's labour force growth was concentrated among core aged and male workers (only older workers reported a decline in labour force). Employment gains over the last year were widespread across cohorts, except among youth. Unemployment was down for core aged and older workers as well as for women, but up among youth and males. With population growing faster than labour force, the numbers not in the labour force increased most for females as well as older workers.
Age and sex cohorts (January-August 2022 vs January-August 2021, seasonally adjusted)
On average over the first eight months of 2022, employment and labour force gains were reported in each age cohort, though growth among youth was more modest while employment growth for males outpaced female employment gains.
Class of Worker (August 2022 vs July 2022, seasonally adjusted)
The July 2022 employment change reflected declines for private sector employees (-3,800 or -1.3%) and self-employment (-4,400 or -8.0%) while public sector employment increased (+3,100 or 2.4%) to partially offset the declines.
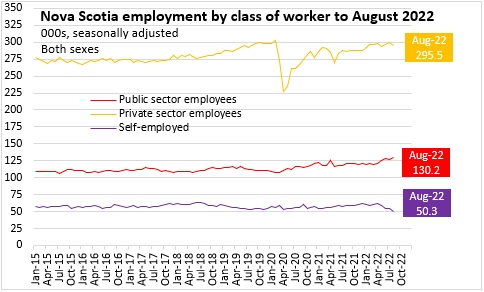
Class of Worker (August 2022 vs August 2021, seasonally adjusted)
Compared August 2021, there were substantial gains in employment for private sector workers (+9,500 or +3.3%), public sector workers (+9,900 or +8.2%) while self employment was down (-8,700 or -14.7%).
Class of Worker (January-August 2022 vs January-August 2021, seasonally adjusted)
Compared with the first eight months of 2021, there were gains in employment for all classes of workers during January to August of 2022: private sector workers (+11,000 or +3.9%), public sector workers (+4,700 or +3.9%) and self employment (+1,000 or +1.7%).
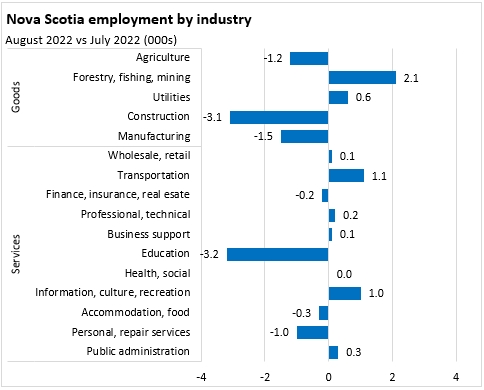
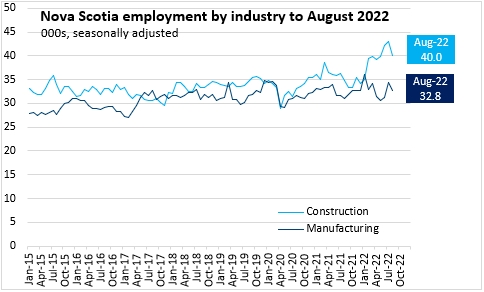
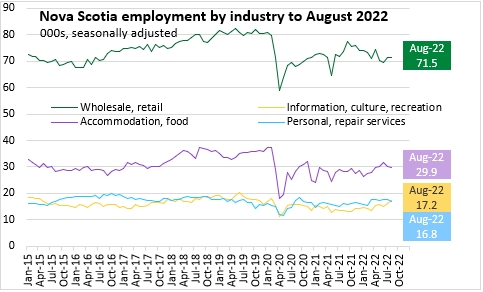
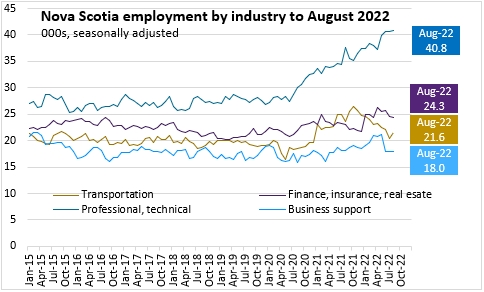
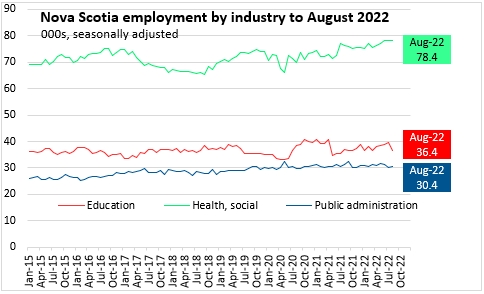
Industry of Employment (August 2022 vs July 2022, seasonally adjusted)
The employment change from July to August reflected notable employment declines in education, construction, manufacturing, agriculture and personal/repair services. There were notable offsetting gains in employment for forestry/fishing/mining, transportation and information/culture/recreation.
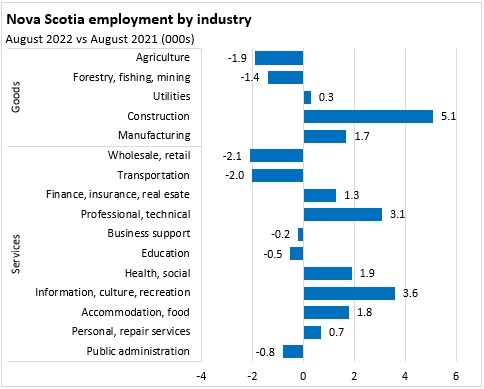
Industry of Employment (August 2022 vs August 2021, seasonally adjusted)
Over the last 12 months, employment has risen across almost all industries with the exceptions of agriculture, forestry/fishing/mining, wholesale/retail, transportation, business support (including call centres), education and public administration. The largest employment gains were in construction, informatio/culture/recreation, professional/technical services, health/social assistance (including daycares), accommodation/food and manufacturing.
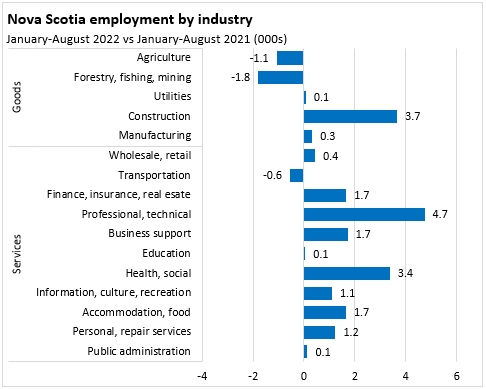
Industry of Employment (January-August 2022 vs January-August 2021, seasonally adjusted)
On average over the first eight months of 2022 (compared with the same period last year), most industries reported employment gains. The increase in year-to-date average employment was fastest for professional/technical services, health/social (including daycare) and construction. Only agriculture, forestry/fishing/mining and transportation reported declining employment on average in 2022.
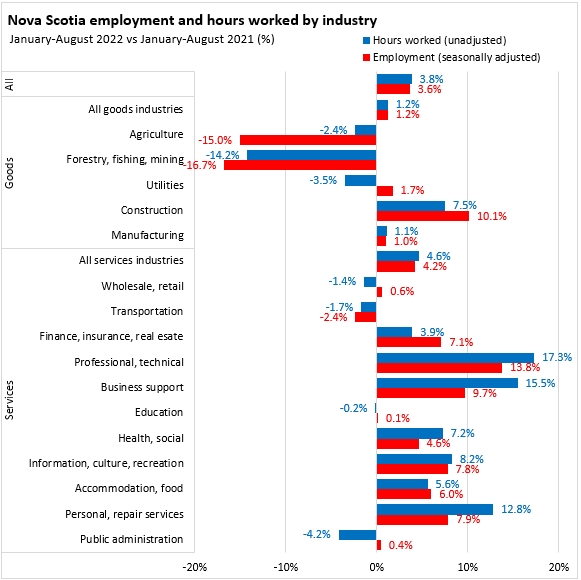
Hours worked and employment (January-August 2022 vs January-August 2021, unadjusted)
Changes in unadjusted hours worked show different variations than changes in seasonally adjusted employment (comparing the average over the first eight months of 2022 with the same period in 2021). Overall employment was up by 3.6% while hours were up by 3.8%.
There were year-to-date contractions in employment for agriculture, forestry/fishing/mining, utilities, wholesale/retail, transportation, education and public administration. However, in agriculture, utilities, wholesale/retail, transportation, education and public administration the impact on hours was notably milder than the contraction in employment. The year-to-date increases in employment were strongest in professional and technical services, business support (call centres) and personal/repair services. In these industries, hours worked grew even faster than employment. Construction employment was also up substantially, but the gain in hours worked was less than the rise in employment.
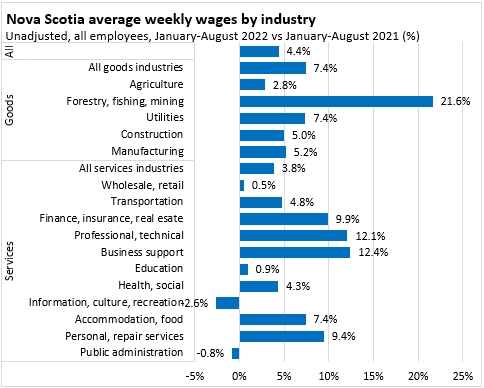
Average weekly earnings (unadjusted, both full time and part time, January-August 2022 vs January-August 2021)
Average weekly earnings increased by 4.4% from January-August 2021 to January-August 2022. Earnings were up by across most industries, with the exceptions of information/culture/recreation and public administration. The fastest gains in average weekly earnings were in forestry/fishing/mining, professional and technical services and business support (which includes call centres).
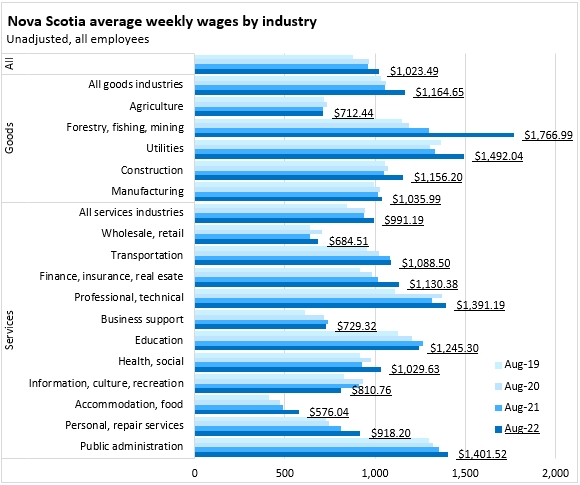
Average weekly earnings across all employees were $1,023.49 in August 2022. The highest average weekly earnings (both full and part time employees) were reported in forestry/fishing/mining, utilities, professional/technical services and public administration. The lowest average weekly earnings were in accommodation/food, wholesale/retail and agriculture.
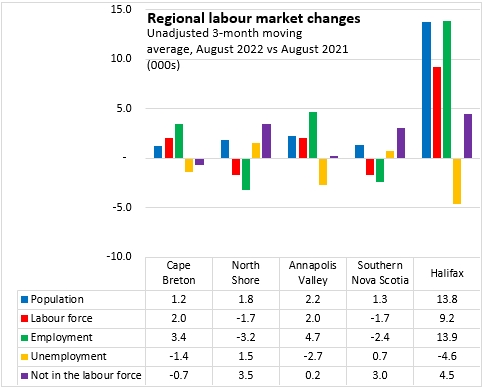
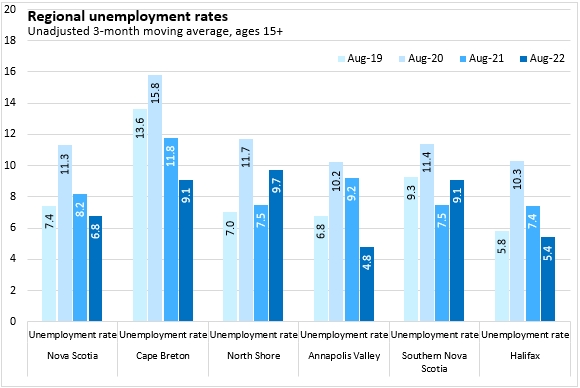
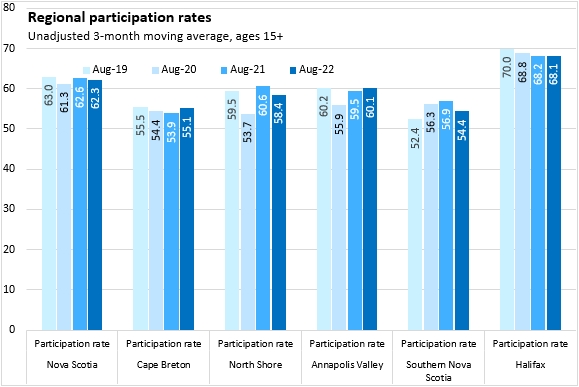
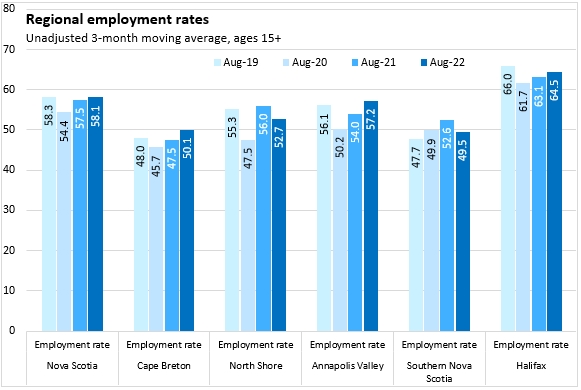
Regions (August 2022 vs August 2021, unadjusted 3 month moving average)
Compared with August 2021, employment and labour force each increased in Halifax, Cape Breton and Annapolis Valley while each decreased in the North Shore and Southern Nova Scotia regions. The unemployment rate declined in Cape Breton, Halifax and the Annapolis Valley where employment gains all outpaced labour force growth. Unemployment rates went up in the North Shore and Southern Nova Scotia economic regions where the decline in employment was larger than the decline in labour force.
Participation rates were up in Cape Breton and the Annapolis Valley but down in the North Shore, Southern Nova Scotia and Halifax economic regions. Employment rates were up for Cape Breton, the Annapolis Valley and Halifax and down for the North Shore and Southern Nova Scotia.
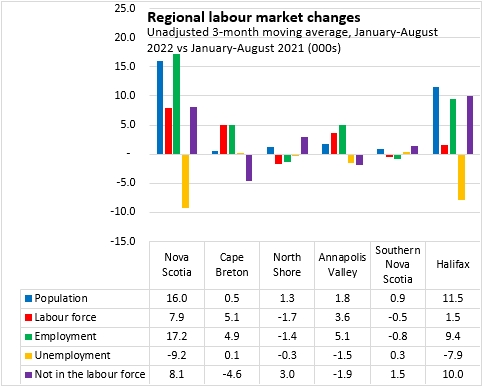
Regions (January-August 2022 vs January-August 2021, unadjusted 3 month moving average)
Comparing the average over the first eight months of 2022 with the same months of 2021, labour force was down for the North Shore and Southern Nova Scotia economic regions. Labour force grew in Cape Breton, the Annapolis Valley and Halifax. Employment was up for Cape Breton, the Annapolis Valley and Halifax while there were declines in the North Shore and Southern Nova Scotia regions.
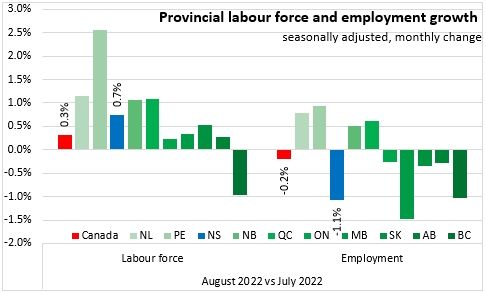
Provincial Comparisons (August 2022 vs July 2022, seasonally adjusted)
Canada's employment decreased by 39,700 (-0.2%) from July to August, a third consecutive month of decline. Manitoba, British Columbia and Nova Scotia reported the largest employment declines. Employment was up only in Quebec and the other Atlantic provinces.
The labour force increased slightly for Canada (+0.3%) with gains in all provinces except British Columbia. The largest increase in labour force was reported in Prince Edward Island.
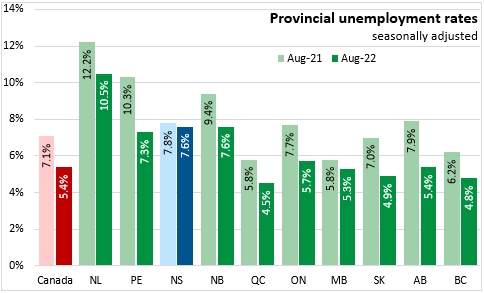
Provincial Comparisons (August 2022 vs August 2021, seasonally adjusted)
Compared with August 2021, Nova Scotia's employment was up 2.3% while labour force expanded by 2.0%. National employment was up 3.1% while labour force increased by 1.2%. All provinces reported employment gains over this period with the fastest growth in Prince Edward Island. All provinces except Saskatchewan reported labour force gains over the last year (also led by Prince Edward Island).

The national unemployment rate was 5.4% in August 2022, up 0.5 percentage points from July 2022 and down from 7.1% in August 2021. Saskatchewan, British Columbia and Quebec had the lowest unemployment rates while Newfoundland and Labrador reported the highest unemployment rate.
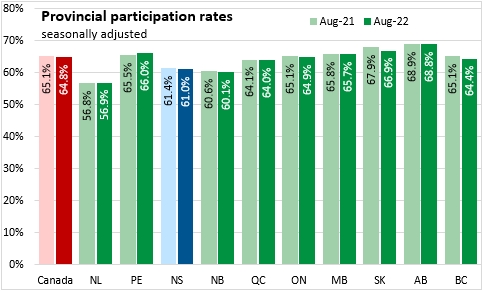
The national participation rate was 64.8% in August 2022. The highest participation rates were in Saskatchewan and Alberta while the lowest was in Newfoundland and Labrador.
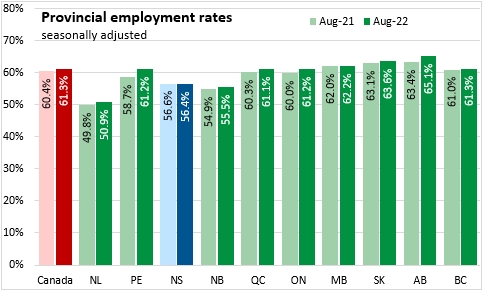
The national employment rate was 61.3% in August 2022. Alberta reported the highest employment rate while Newfoundland and Labrador reported the lowest.
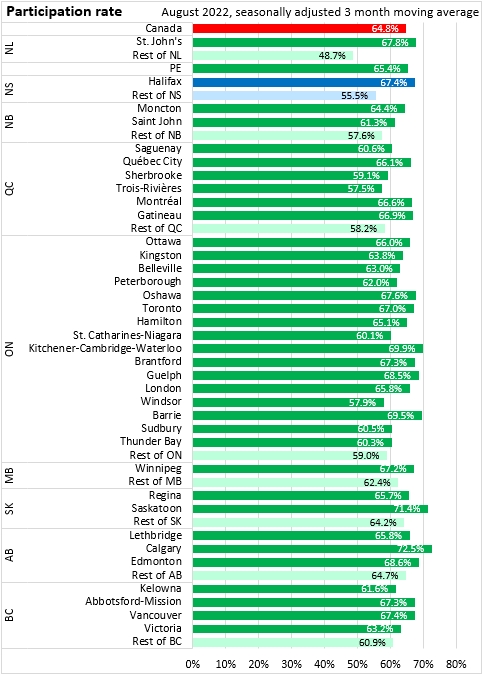
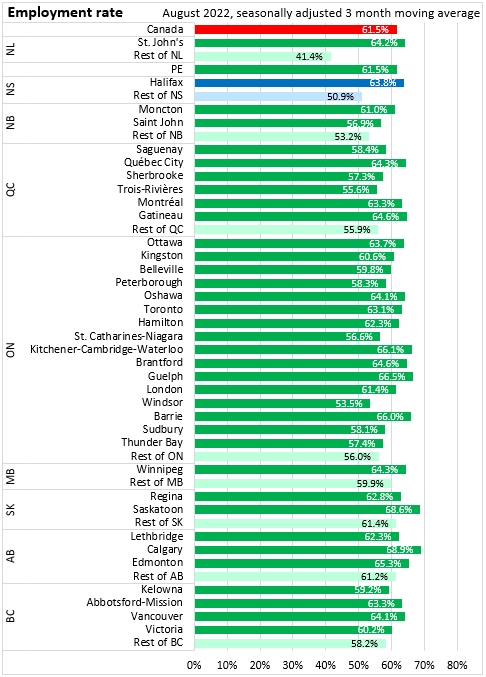
Census Metropolitan Areas (August 2022, seasonally adjusted 3 month moving average)
The Halifax unemployment rate was 5.4% in the seasonally adjusted August 2022 three month moving average. This was just above the average for other Census Metropolitan Areas, but lower than in the rest of Nova Scotia (8.3%). In central and western provinces, unemployment rates in Census Metropolitan Areas are similar to or higher than unemployment rates outside CMAs. In the Atlantic Provinces unemployment rates are typically higher outside CMAs.
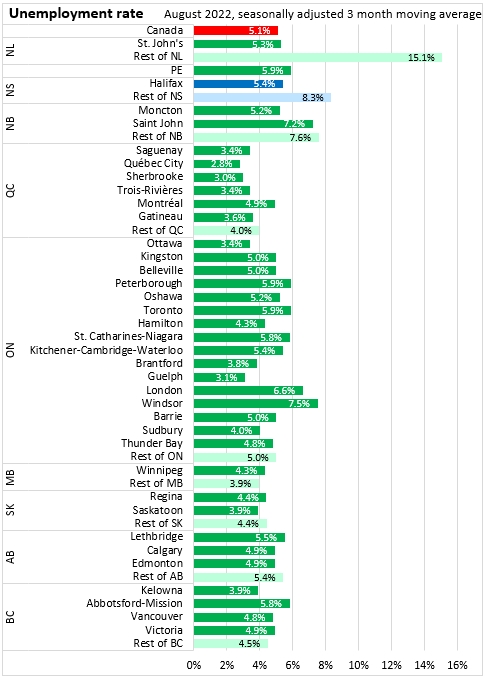
Halifax's participation rate was 67.4% in the seasonally adjusted August 2022 three month moving average while participation rates were 55.5% across the rest of the province.
Halifax reported an employment rate of 63.8% in the seasonally adjusted August 2022 three month moving average while the employment rate was 50.9% outside the city.
Sources: Statistics Canada. Table 14-10-0036-01 Actual hours worked by industry, monthly, unadjusted for seasonality; Table 14-10-0063-01 Employee wages by industry, monthly, unadjusted for seasonality; Table 14-10-0287-01 Labour force characteristics, monthly, seasonally adjusted and trend-cycle, last 5 months; Table 14-10-0380-01 Labour force characteristics, three-month moving average, seasonally adjusted; Table 14-10-0387-01 Labour force characteristics, three-month moving average, unadjusted for seasonality, last 5 months; Table 14-10-0355-01 Employment by industry, monthly, seasonally adjusted and unadjusted, and trend-cycle, last 5 months (x 1,000); Table 14-10-0288-01 Employment by class of worker, monthly, seasonally adjusted and unadjusted, last 5 months (x 1,000); Table: 14-10-0380-02 Labour force characteristics, three month moving average, seasonally adjusted (x 1,000)
<--- Return to Archive