The Economics and Statistics Division maintains archives of previous publications for accountability purposes, but makes no updates to keep these documents current with the latest data revisions from Statistics Canada. As a result, information in older documents may not be accurate. Please exercise caution when referring to older documents. For the latest information and historical data, please contact the individual listed to the right.
<--- Return to Archive
For additional information relating to this article, please contact:
August 24, 2022QUARTERLY FINANCIAL STATISTICS FOR ENTERPRISES, Q2 2022 In Q2 2022, Canadian enterprise net income before taxes (seasonally adjusted) increased by $9.3 billion from the previous quarter to $151.7 billion. Net income before taxes was up $10.0 billion for non-financial corporations and was down $0.7 billion in finance and insurance corporations. Rising commodity prices, high inflation, and Bank of Canada increasing its policy rate impacted Canadian corporate sector in Q2.
Compared with Q2 2021, net income before taxes increased by $26.7 billion: $25.55 billion for non-financial corporations and $1.3 billion for finance and insurance corporations.

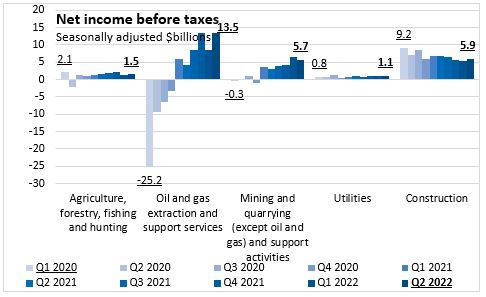
Oil and gas extraction (and related support activities) reported the largest improvements in net income before taxes, rising $4.9 billion to $13.5 billion in Q2 2022. Net income before taxes were up Agriculture, forestry and fishing and hunting by $126 million to $1.5 billion and construction was up $449 million to $5.9 billion.
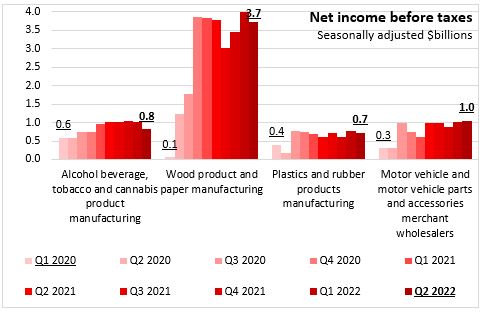
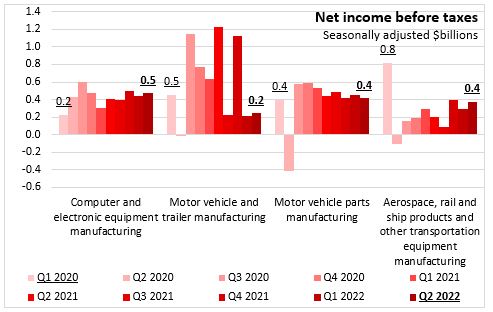
Petroleum and coal product manufacturing also was up substantially with a $3.1 billion increase to $8.0 billion in the quarter with higher prices and rising pre-tax profit margins. Net income before taxes fell for food manufacturing; alcohol beverage tobacco and cannabis product, wood and paper product, pharmaceutical, soap and agriculture products; plastics and rubber products, and motor vehicle part manufacturing in Q2 2022 compared to Q1 2022.

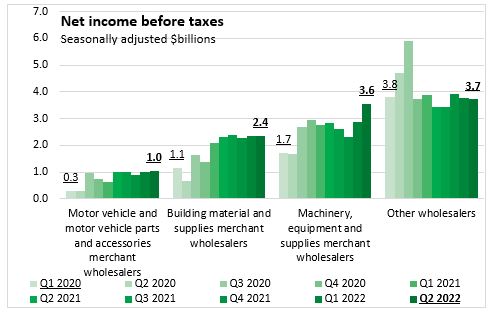
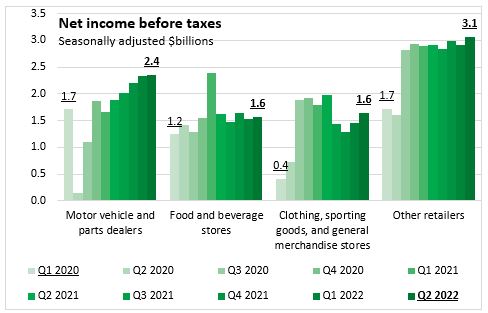
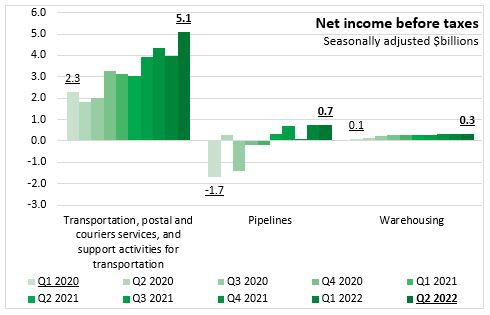
In service industries associated with distribution of goods (wholesale, retail, transportation/warehousing), net income before taxes was up notably compared to last quarter for machinery, equipment and supplies merchant wholesalers and transportation, postal and courier services and support activities for transportation. Commercial aviation being key factor with higher cargo activity and rising passenger numbers. Rail transportation activity was up with movement of energy products, metals and minerals.
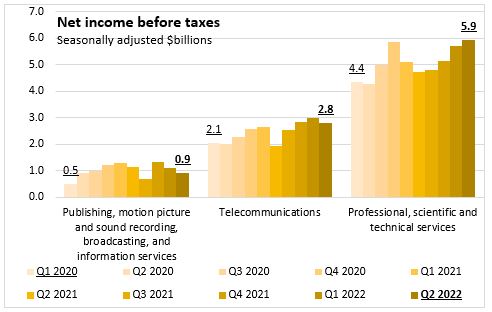
Net income before taxes continued to increase for professional, scientific and technical services ($5.9 billion) in Q2 2022.
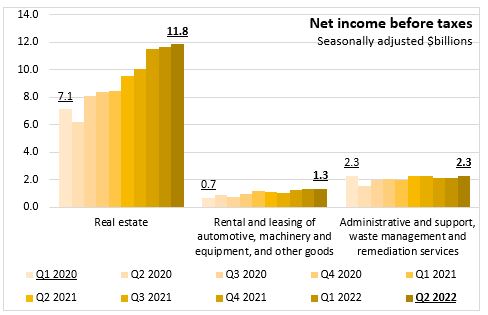
Real estate corporate net income increased to $11.8 billion and was 24.4% higher in Q2 2022 than Q2 2021.
Net income for the arts, entertainment and recreation, and accommodation and food services sector have been particularly hard hit by the pandemic. These corporations had a $107 million net income before taxes in Q2 2022.

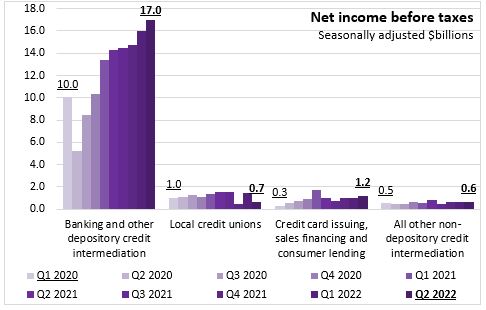
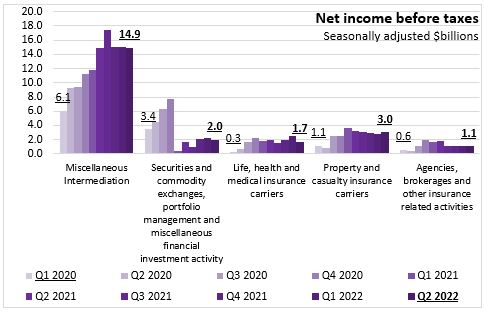
Among financial corporations, net income was down 1.6% or $702 million with the largest decline in life, health and medical insurance carriers (-$794 million) that experienced asset valuation losses from lower equity markets. Property and casualty insurance carriers net income before taxes were up as higher revenue from more driving offset higher expenses from severe weather claims in Ontario and Quebec. Banking and other depository credit intermediate was up $953 million to $17.0 billion on higher net interest income from rising mortgage loans in the quarter.
Source: Statistics Canada. Table 33-10-0226-01 Quarterly balance sheet and income statement, by industry, seasonally adjusted (x 1,000,000)
<--- Return to Archive