The Economics and Statistics Division maintains archives of previous publications for accountability purposes, but makes no updates to keep these documents current with the latest data revisions from Statistics Canada. As a result, information in older documents may not be accurate. Please exercise caution when referring to older documents. For the latest information and historical data, please contact the individual listed to the right.
<--- Return to Archive
For additional information relating to this article, please contact:
August 22, 2022STATISTICS CANADA POPULATION PROJECTIONS 2022-2043 Statistics Canada has updated its population projections for Canada (to 2068) and the Provinces and Territories (to 2043) based on 2021 starting period. Projections include several scenarios based on both short and long term component trends, providing a variety of potential outcomes. The population projections are not forecasts, but represent an attempt to establish plausible long-term scenarios based on fertility, mortality and migration. A table of each scenario assumption and links to the full methodology are at the end of the article.
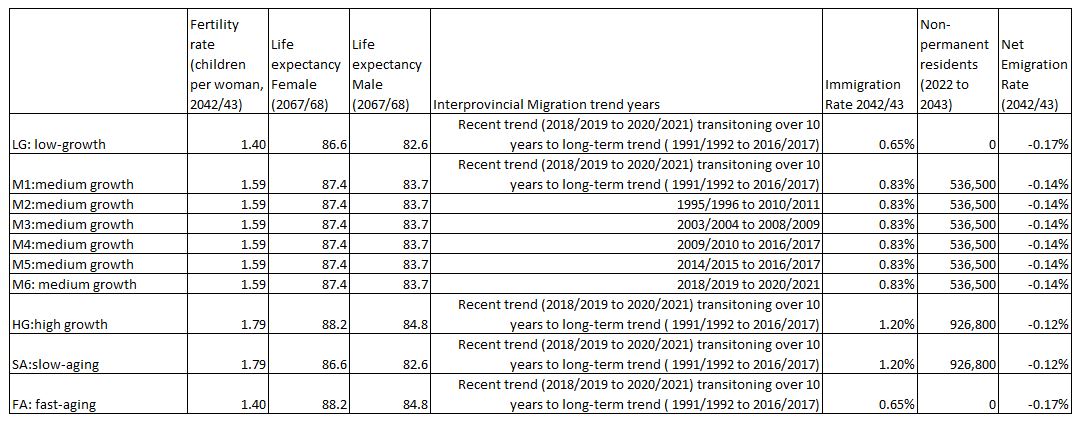
The low-growth scenario is based on having lower assumptions for all components (fertility, life expectancy and immigration) than the medium- and high-growth scenarios. The six medium growth scenarios are based on the same fertility, life expectancy, and immigration assumptions as one another but differ on the interprovincial migration assumptions across six scenarios (M1-M6). The interprovincial assumption for M1 used a short to long-term method where the recent trend (2018/2019 to 2020/2021) linearly transition to the long-term trend (1991/1992) over the first ten years of the projections. This interprovincial migration assumption is used for the low-growth, high-growth, slow-aging and fast aging scenarios. The M2-M6 scenarios are based on maintaining an average interprovincial migration rate based on different time periods. The slow-aging scenario assumes the high-growth assumptions on fertility and immigration but a slower increase in life expectancy. The fast-aging scenario assumes the low-growth assumptions on fertility and immigration but greater gains in life expectancy. Historical and projected populations are presented for July 1 of each year.
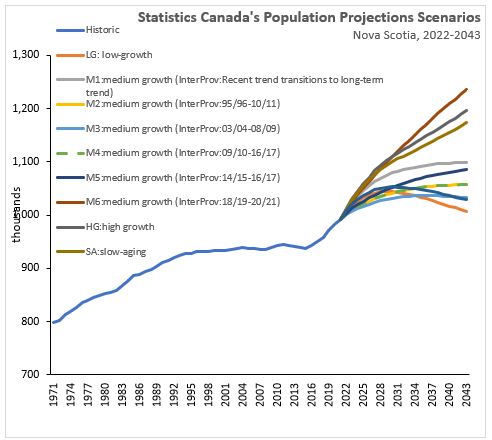
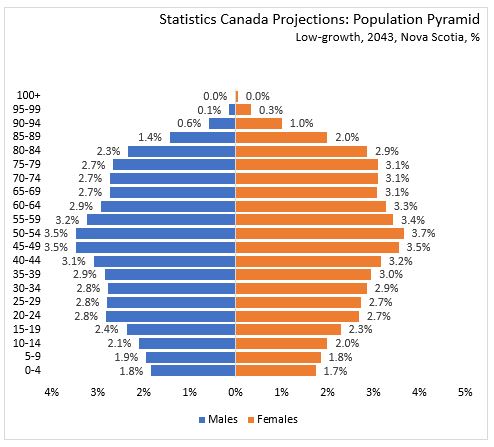
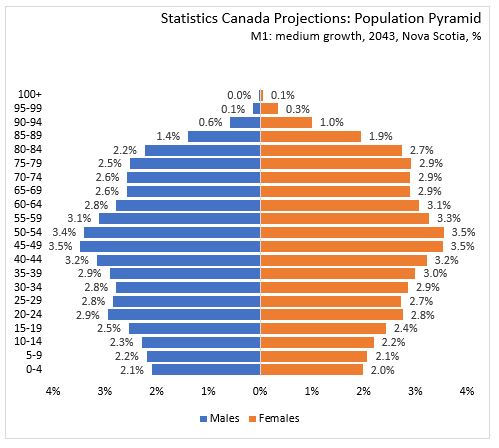
Nova Scotia's population was 992,055 on July 1, 2021 having grown by 6.2% over the past 22 years. Statistics Canada's population projections for the next 22 years range from growth of 1.4% under the low-growth scenario to growth of 24.6% under the M6 growth scenario. The low-growth scenario has Nova Scotia's population growing before decline to 1,006,300 by 2043, M5 also grows before decline. The other scenarios generally having growing population, with the high growth scenario results in a population of 1,196,300 and the M6 scenario to 1,236,300 in 2043. The M1 scenario is for population to grow rapidly in short-term, based on recent interprovincial migration strengthen continuing, before slower growth to reach 1,099,300 in 2043.

The age structure of Nova Scotia's population has some common trends across all the scenarios. Under all scenarios the number of persons aged 65 and over will increase by 2043, particularly during the period 2022-2030. Under every scenario, the number of persons aged 65 and over will peak during the 22 year projection period and being to decline, although for some scenarios only in the 2040s. The direction for the population aged 18 to 64 years is mixed with growth under M1, M5, M6, high-growth and slow aging scenario. Under low-growth scenario, the 18-64 population declines 4.9%. The youth population (age 0-17) has significant growth under M6, high-growth and slow-aging scenario.

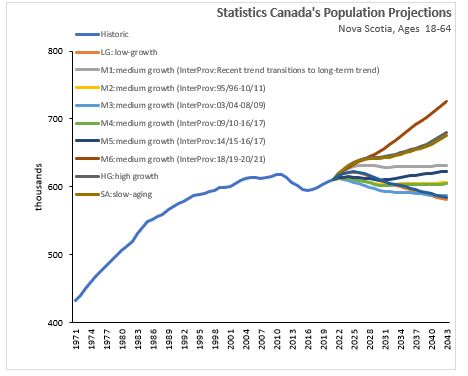
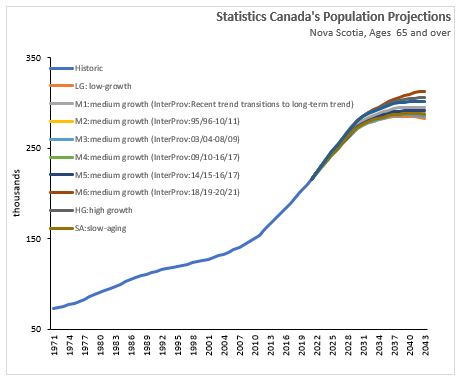
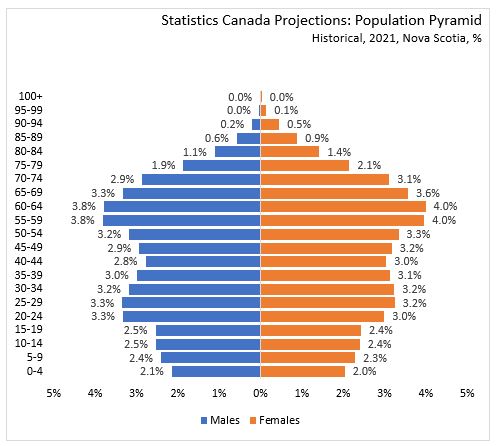
Nova Scotia’s population is projected to be older under all scenarios with a larger share of the population aged 65 and over. In 2021, 21.8% of the population was aged 65 and over. Statistics Canada population projections have this share increasing to a range of 24.5% (slow aging ) to 29.3 per cent (fast aging) in 2043. The share aged 18 to 64 is projected to decline from current 61.5% to be in a range of 54.6 to 55.7% in 2043 under all scenarios. The youth population (aged 0-17) share is currently 16.7% and is projected to decline only in the low-growth and fast-aging. A higher youth share is projected under all medium scenarios, high-growth and slow aging. Under all scenarios the dependency ratio (youth and senior population as a share of population aged 18-64) will rise from the current 0.63 to be over 0.70 in all scenarios with the lowest with M6 (0.70) and highest of 0.76 with M3, high growth and fast-aging.


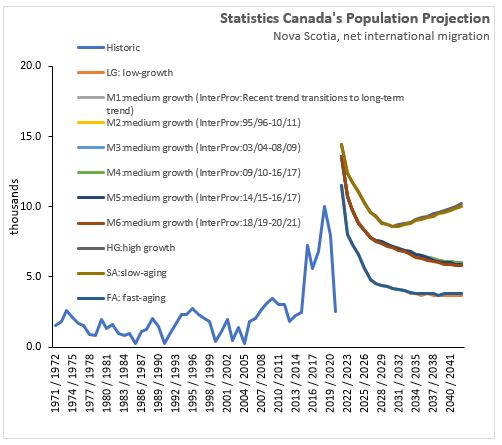
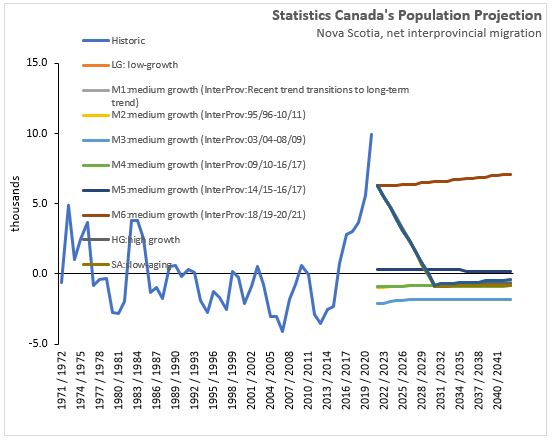
All scenarios have more deaths than births, resulting in a negative natural population change in all years of the projections. Net international migration projections vary from high-growth scenario that is above COVID-19 levels and has average level of around 9,000 per year. Medium growth scenario also start elevated with the strong 2022 immigration expectations incorporated into the scenarios, the medium scenarios average around 7,500 per year. A low-growth scenario would average 4,800 per year for the 2022-2043. Interprovincial migration are projected based on different historical time periods for the six medium scenarios with all other assumptions kept constant. Nova Scotia's highest medium-growth scenario being M6 when interprovincial migration is based on recent patterns of 2018/19 to 2020/21 continuing over the next 22 years. The interprovincial migration scenario used for M1, low-growth and high-growth has interprovincial migration declining into modest negative territory (-800/year) by 2030/31.

Canada's population is projected to increase from 38.2 million in 2021 to between 44.9 million (low growth) to 74.0 million (high growth) in 2068. The medium growth scenario would have the population at 56.5 million in 2068.
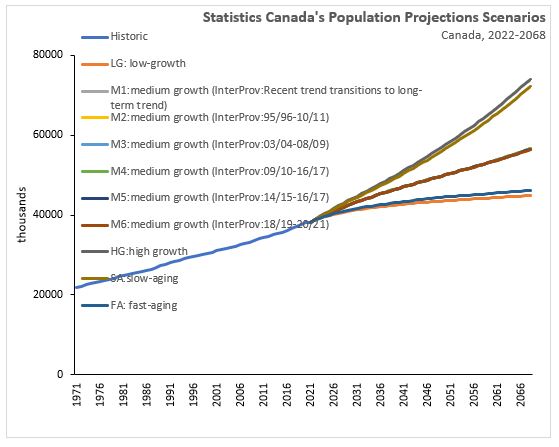
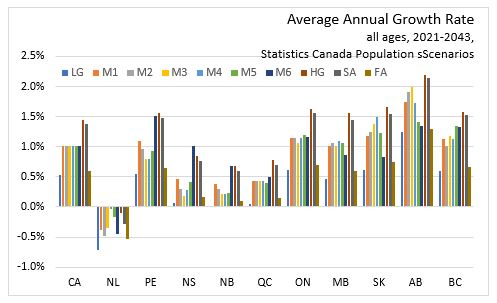
According to all projection scenarios, Ontario would remain the most populous province and the rate of population growth in Alberta would be the highest among Canadian provinces over the next 22 years. Newfoundland and Labrador population is projected to decline under most scenarios.
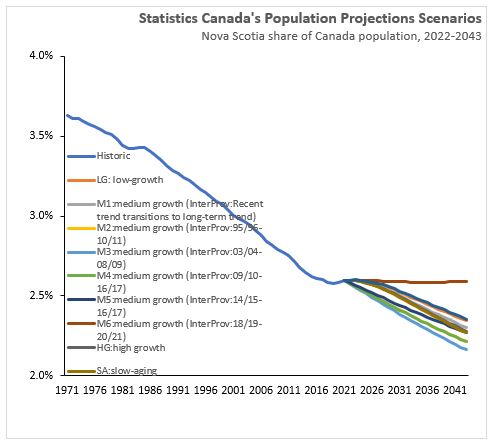
Under all but one scenario, Nova Scotia's population is projected to decline as a proportion of Canada's. Nova Scotia accounts for 2.59% of Canada's population in 2021 and is projected to decline to a 2.16% share with M3. Under M6 scenario, maintaining recent interprovincial migration, Nova Scotia's share of Canada population would continue around 2.59% over the projection horizon.
The following table presents the scenarios assumptions for Canada, additional distributional assumptions and estimates are needed to produce projections at the provincial level. For instance, immigration rates at provincial level are modelled as the beginning of the projection as near current levels and then returning to a 10 year average after a period of time. For the full methodological document, see Population Projections for Canada (2018 to 2068), Provinces and Territories (2018 to 2043): Technical Report on Methodology and Assumptions.
Source:
Statistics Canada. Table 17-10-0057-01 Projected population, by projection scenario, age and sex, as of July 1 (x 1,000)
Statistics Canada. Table 17-10-0058-01 Components of projected population growth, by projection scenario (x 1,000)
Statistics Canada. Table 17-10-0005-01 Population estimates on July 1st, by age and sex
Statistics Canada. Table 17-10-0008-01 Estimates of the components of demographic growth, annual
<--- Return to Archive