The Economics and Statistics Division maintains archives of previous publications for accountability purposes, but makes no updates to keep these documents current with the latest data revisions from Statistics Canada. As a result, information in older documents may not be accurate. Please exercise caution when referring to older documents. For the latest information and historical data, please contact the individual listed to the right.
<--- Return to Archive
For additional information relating to this article, please contact:
August 16, 2022ANALYSIS OF NOVA SCOTIA'S CONSUMER PRICE INDEX FOR JULY 2022 TRENDS – July 2022
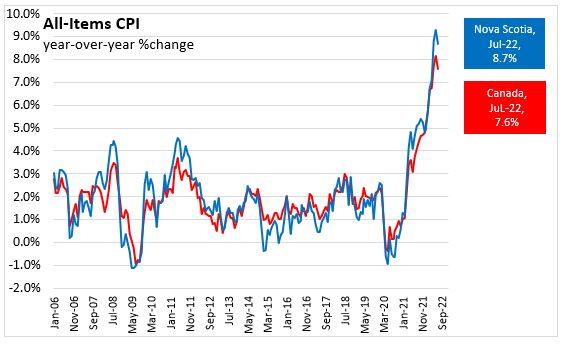
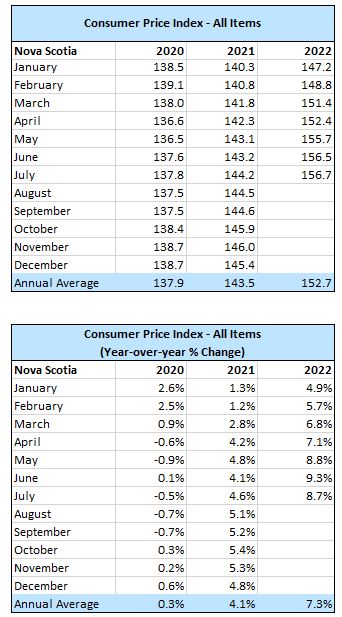
Nova Scotia’s All-Items Consumer Price Index (CPI) increased 8.7% year-over-year in July 2022, down from the 9.3% year-over-year increase in June. Nationally, consumer prices also decelerated from 8.1% last month to being 7.6% higher than July 2021.
Inflation was highest in Prince Edward Island (+9.5%) while Quebec (+7.3%) had the lowest. Compared to the previous month, all provinces except British Columbia had slower year-over-year inflation.

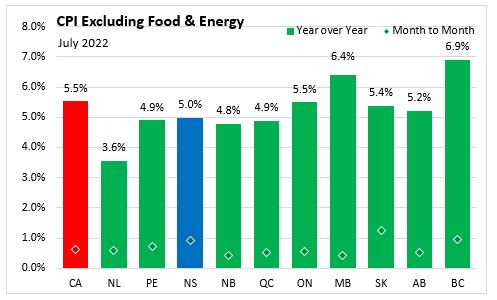
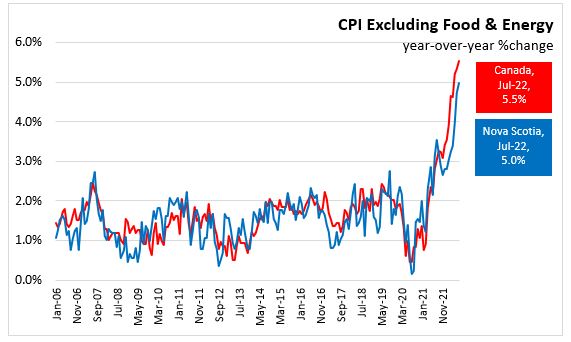
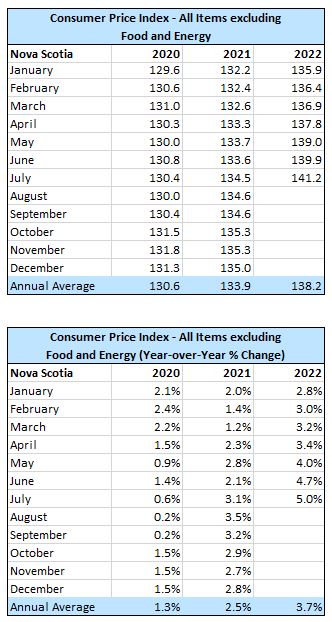
Nova Scotia’s consumer price inflation (year-over-year) excluding food and energy increased 5.0% in July 2022. Consumer prices excluding food and energy were up in all provinces led by British Columbia (+6.9%). Newfoundland and Labrador had the smallest increase at 3.6%.
For Canada, prices for travel and gathering services increased during busy travel season.
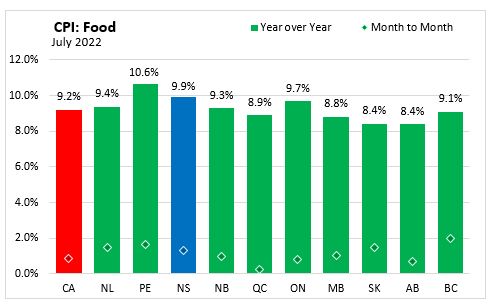
The CPI for food in Nova Scotia increased 9.9% year-over-year in July 2022. Nationally, food prices were also up 9.2% from a year earlier. All provinces recorded year-over-year increase in food prices led by Prince Edward Island (+10.6%). Saskatchewan and Alberta had the lowest increase at 8.4%.
Compared to the previous month, food prices in Nova Scotia were up 1.3%, more than the national average of 0.9%.
Canadians paid 9.9% more for food purchased from stores when compared to July 2021 - more than the 9.4% increase recorded in June. Bakery products continued to rise at faster pace with elevated wheat prices from higher input costs and global supply uncertainty. Faster price growth occurred in non-alcoholic beverages, sugar and confectionery, preserved fruit and fruit preparations, eggs, fresh fruit, and coffee and tea.
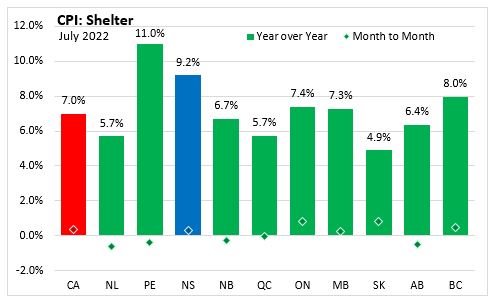
Year-over-year, shelter costs in Nova Scotia increased 9.2% in July 2022.
In July, shelter prices increased 7.0% year-over-year across Canada, slower than the 7.1% year-over-year increase recorded in June. The mortgage interest cost index increased for the first time since September 2020 with the higher interest rate environment. Growth slowed in owned accommodation expenses and homeowners' replacement cost while rent increased faster, driven by acceleration in Ontario and Alberta.
Compared to July 2021, shelter prices were up in all provinces with the largest increase in Prince Edward Island (+11.0%) and the smallest increase in Saskatchewan (+4.9%).
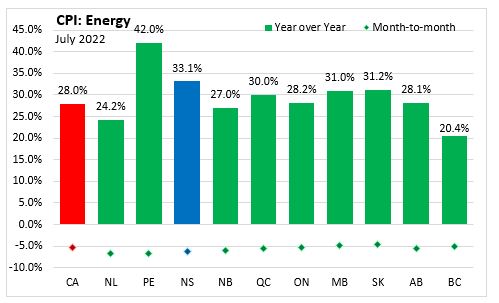
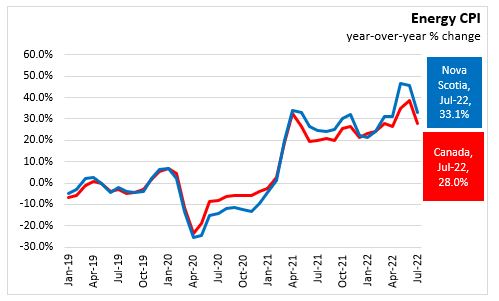
Nova Scotia's consumer price inflation (year-over-year growth in CPI) for energy was 33.1% in July, above the national average of 28.0%. Prince Edward Island (+42.0%) posted the largest year-over-year increases while British Columbia (+20.4%) had the smallest change in the energy index.
For Canada, consumers paid 9.2% less in gasoline in July compared to June, the largest monthly decline since April 2020. Natural gas prices were up with approval of rate increases in Ontario coming into effect while electricity prices were down in Alberta on a provincial rebate program.
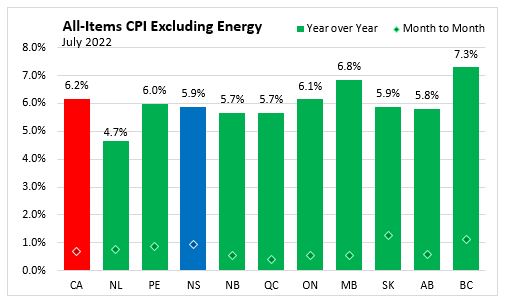
Nova Scotia's consumer price inflation (year-over-year growth in CPI) excluding energy was 5.9% in July compared to a national rate of 6.2%. British Columbia (+7.3%) posted the largest year-over-year gain while Newfoundland and Labrador (+4.7%) had the smallest change in the CPI excluding energy.
Major Components for July 2022
The following table shows the price increases specific to Nova Scotia for the major components of the CPI this month.

The main contributors to the monthly change (July 2022 vs June 2022) in Nova Scotia CPI were:
- Traveller accommodation (+16.4%)
- Rent (+2.1%)
- Passenger vehicle parts, maintenance and repairs (+2.4%)
- Gasoline (-10.1%)
- Fuel oil and other fuels (-3.2%)
- Household textiles (-9.7%)
The main contributors to the yearly change (July 2022 vs July 2021) in Nova Scotia CPI were:
- Gasoline (+37.8%)
- Fuel oil and other fuels (+63.8%)
- Rent (+8.4%)
- Video and audio subscription services (-11.3%)
- Telephone services (-4.7%)
- Child care and housekeeping services (-13.0%)
Long Run Trends
In July 2022, the all-items CPI year-over-year inflation rate for Nova Scotia was 8.7%, above the national inflation rate of 7.6%.
Nova Scotia’s CPI excluding food and energy increased 5.0%. Canada CPI excluding food and energy rose 5.5%. The NS CPI excluding food and energy was previously higher in March 2003 (+5.1%).
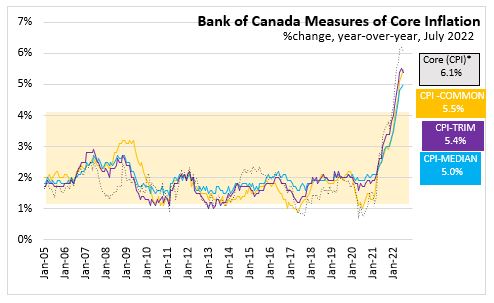
Bank of Canada's preferred measures of core inflation
Compared to July 2021, CPI-Common increased 5.5%, CPI-Median increased 5.0% and CPI-Trim was up 5.4% in Canada. All-items CPI excluding eight of the most volatile components as defined by the Bank of Canada and excluding the effect of changes in indirect taxes (formerly referred to as CPIX), rose 6.1% year-over-year. The change in the core inflation measures was up 0.2 percentage points for CPI-common, down 0.1 percentage points for CPI-trim and up 0.1 percentage point for CPI-median from the previous 12-month period.
Appendix Tables and Charts
Basket Update - May 2022
As part of schedule update, Statistics Canada has updated the basket weights based on 2021 expenditures. A used vehicle price was introduced into the CPI Compared to the previous basket reference year of 2020 for Nova Scotia, increase weight for transportation (+2.04 percentage points) and clothing and footwear (+0.52 percentage points) were offset by lower weights for food (-0.5 percentage points), shelter (-0.53 percentage points), health and personal care (-0.65 percentage points) and recreation, education and reading (-0.5 percentage points). Statistics Canada noted that at national level the headline CPI growth rate would be the same using the previous weights. For full details on the weight update, see An Analysis of the 2022 Consumer Price Index Basket Update, Based on 2021 Expenditures.
Source: Statistics Canada. Table 18-10-0004-01 Consumer Price Index, monthly, not seasonally adjusted; Table 18-10-0256-01 Consumer Price Index (CPI) statistics, measures of core inflation and other related statistics - Bank of Canada definitions
<--- Return to Archive