The Economics and Statistics Division maintains archives of previous publications for accountability purposes, but makes no updates to keep these documents current with the latest data revisions from Statistics Canada. As a result, information in older documents may not be accurate. Please exercise caution when referring to older documents. For the latest information and historical data, please contact the individual listed to the right.
<--- Return to Archive
For additional information relating to this article, please contact:
July 13, 2022CENSUS INCOME, 2021 Today's release of 2021 Census results include data on income of Canadians. Data collected in the 2021 Census reflect income data for the 2020 taxation year. This year was extraordinary in a number of respects, notably the sharp employment losses during the early stages of the COVID-19 pandemic and the implementation of large transfer programs such as the Canadian Emergency Response Benefit to stabilize incomes.
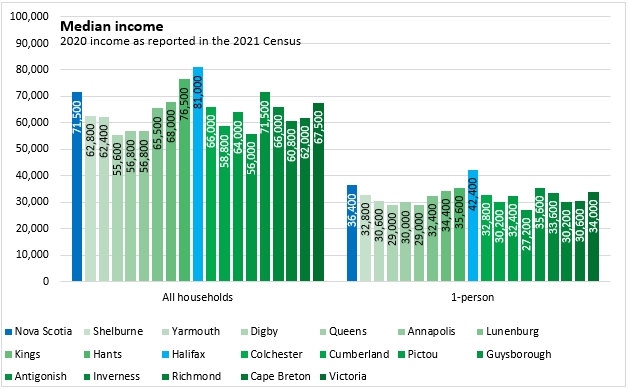
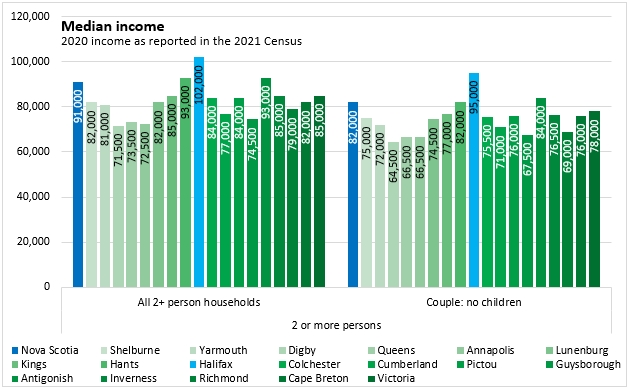
The median income of all Nova Scotia households was $71,500 in 2020 (85.1% of the national median income). Median incomes depend on the number of persons. Among one person households, the median income in Nova Scotia was $36,400 (87.5% of the national median) while among 2 or more person households, Nova Scotia's median income was $91,000 (86.7% of the national median).
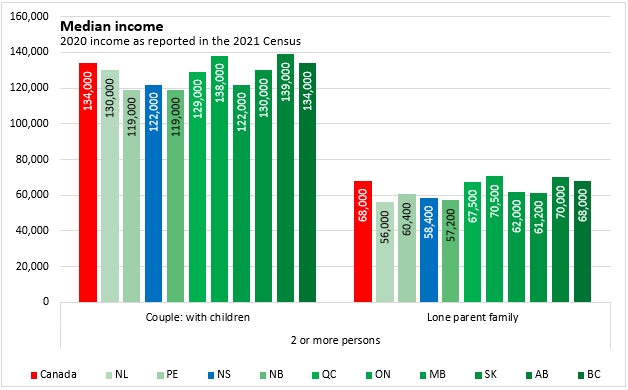
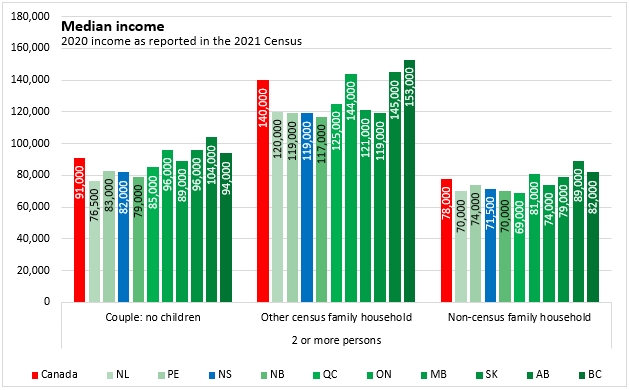
Across Canada, median incomes were higher in Ontario and Alberta and lower in the Atlantic Provinces.

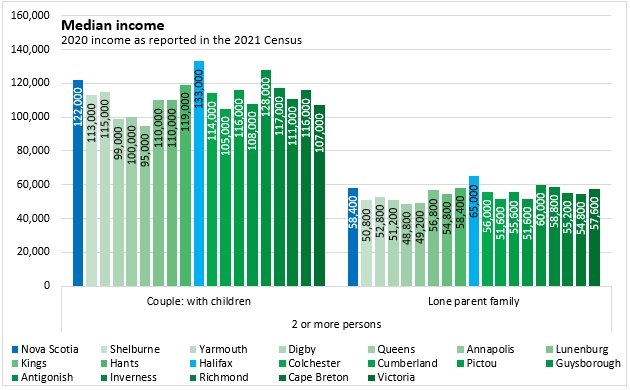
Among families with children, the median income for Nova Scotia couples was $122,000 (91.0% of the national median) while the median income for lone parents was $58,400 (85.9% of the national median).
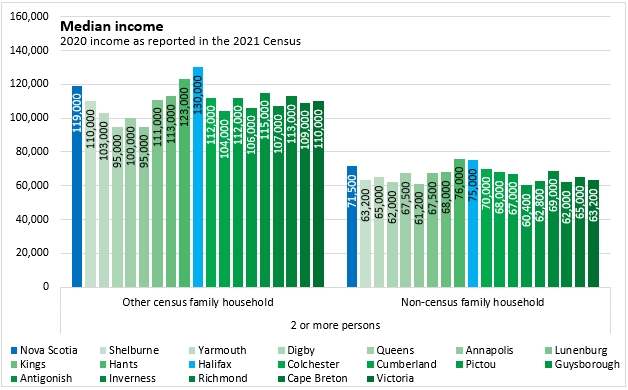
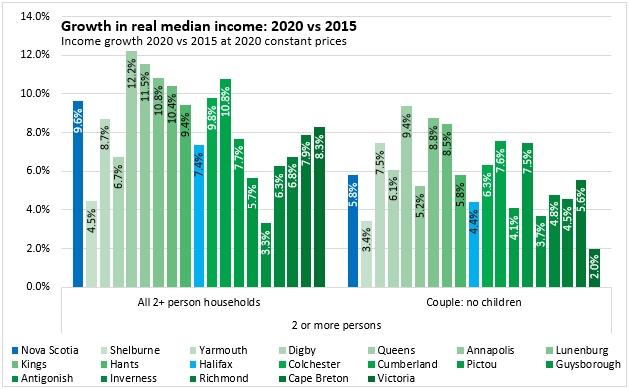
Median incomes for Nova Scotia couples with no children ($82,000 or 90.1% of the national median) were lower than median incomes for couples with children. Median incomes for 2 or more persons living in a non-census family household were $71,500 in Nova Scotia (91.7% of the national median).
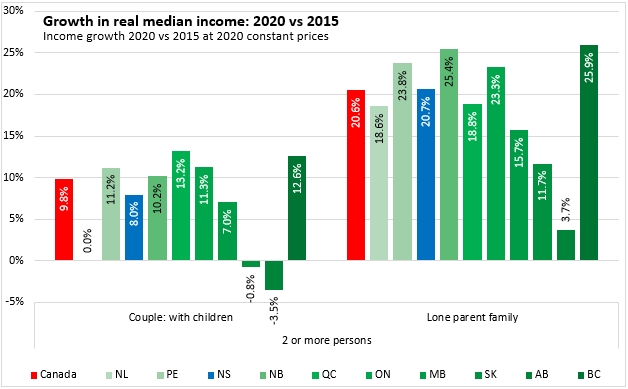
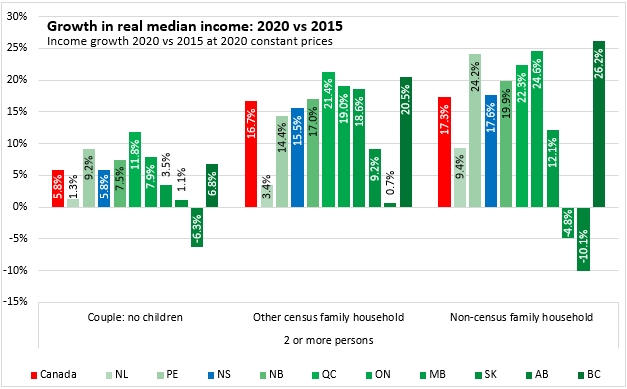
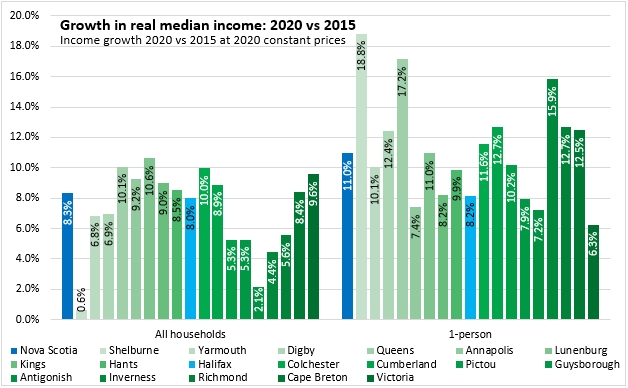
Including the net effects of extraordinary federal transfers, lost employment income and changing prices (ie: all figures are stated at real $2020 prices), median incomes increased by 8.3% from 2015 to 2020 in Nova Scotia. This was slower than the national pace of 10.5%. Ontario and Quebec reported the strongest growth in overall median income while Alberta and Newfoundland and Labrador reported the only declines (Saskatchewan was virtually unchanged).

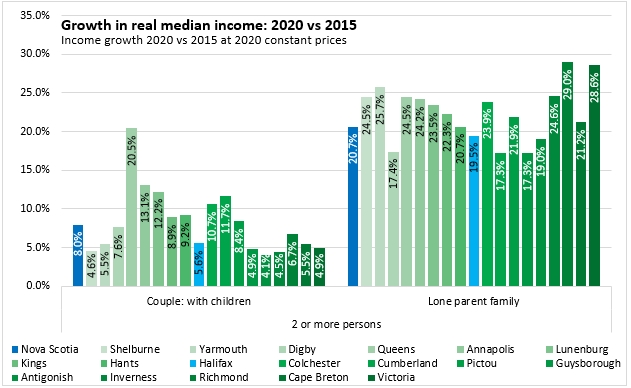
Median income growth was notably stronger for lone parent families, up by 20.7% from 2015 to 2020 (including the implementation of the Canada Child Benefit). Growth in median income for couples with children was slower than for lone parent families.
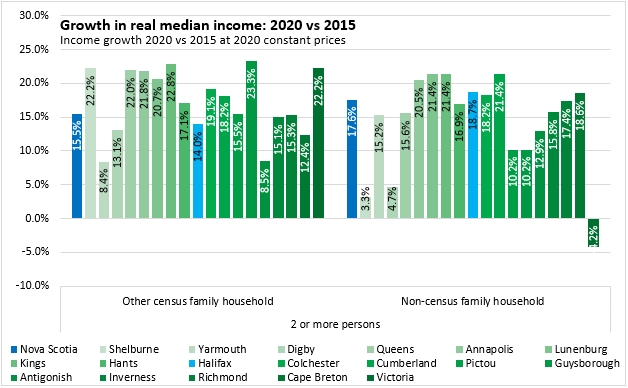
Income growth for non-census family households and 'other' census family households was also stronger than growth in income for couples (either with or without children).
Among Nova Scotia's counties, overall median incomes were strongest in Halifax, Hants and Antigonish counties. Incomes were generally lower in Digby, Queens, Annapolis and Guysborough counties.
Overall median income growth from 2015 to 2020 was fastest in Queens, Colchester and Lunenburg Counties. Growth was slowest (overall) in Shelburne and Antigonish Counties.
Income growth for lone parent families in Nova Scotia was fastest for Richmond and Victoria Counties.
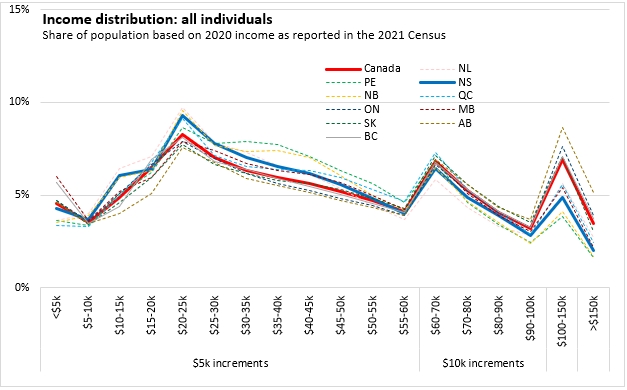
Income distribution (all households)
Measuring the share of the population in income ranges shows that Nova Scotia has a larger share of its population (relative to the national average) in income ranges below $60,000. The share of Nova Scotia's population with income ranging from $60,000 to $100,000 was just below the national average while the share of Nova Scotia's population with incomes over $100,000 was well below the national average.
The Gini coefficient is a measure of income equality. A value of 1 indicates total inequality (only one person has all the income) while a value of 0 indicates complete equality (all individuals have identical income).
Nova Scotia's distribution of market income (such as employment or investment returns) was slightly more equal than the national average. Newfoundland and Labrador had the least equal distribution of market income while Prince Edward Island had the most equal distribution.
Once government transfers were added, there was a substantial increase in equality (ie: lower Gini coefficient) for all provinces. Ontario reported the least equality of total income while Prince Edward Island and New Brunswick reported the most equal distribution of total income.
After taxes (which increased equality somewhat because of progressive taxation), New Brunswick and Prince Edward Island had the most equal income distributions while Ontario, Alberta and British Columbia had the least equal distributions.

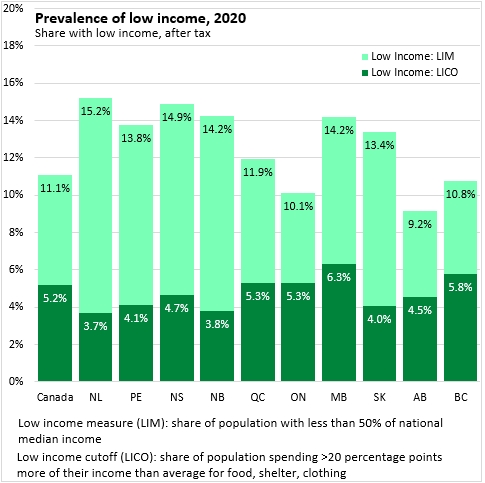
Prevalence of low income
Statistics Canada cautions: Data from the census on the market basket measure (MBM), Canada's official poverty line, will be released in the coming months. It is important to note that trends in the market basket measure and low income measure (LIM) rates sometimes differ. This is due to differences in the way the two measures calculate low income.
The MBM is based on the concept of an individual or family not having enough income to afford the cost of a basket of goods and services. Therefore, when the incomes of lower-income people rise, the MBM rate tends to fall, because more people can afford this basket of goods and services.
The LIM is based on the concept of an individual or family having a low income relative to the Canada-wide median. In general, for the LIM rate to fall, the income gap between lower-income people and other people has to narrow.
It is important to consider both indicators for a more complete picture of low-income trends in Canada. For example, according to survey data, the MBM rate for seniors declined steadily, from 7.1% in 2015 to 3.1% in 2020, while the LIM rate changed little. A decline in the MBM rate for seniors shows that the income levels of lower-income seniors have improved, but stability in their LIM rate shows that the income gap between lower-income seniors and other Canadians is steady.
Using both measures of low income (low income measure, low-income cutoff) reported in the 2021 Census results released today provides an ambiguous picture of low income in 2020. By the low income measure (which assesses incomes relative to the national median), Nova Scotia had the second highest prevalence of low income among provinces after Newfoundland and Labrador. However, by the low income cutoff (which assesses the share of households that spend a 20 percentage point greater share of their income on food, clothing and shelter), Nova Scotia's low income was below the national average while Manitoba's was the highest. Alberta reported the lowest prevalence of low income under the LIM measure. Despite reporting the highest prevalence of low income in the low income measure, Newfoundland and Labrador reported the least prevalence of low income under the low-income cutoff.
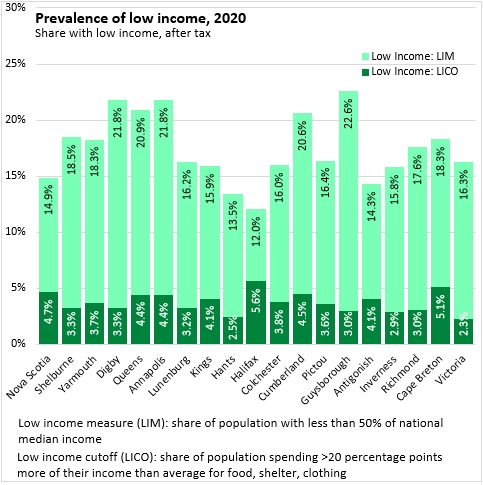
Among Nova Scotia's counties, Guysborough, Digby, Queens and Annapolis reported the most prevalence of low income under the low income measure while Halifax reported the least. By the low income cutoff, Halifax reported the highest prevalence of low income while Victoria and Hants counties reported the least.
Source: Statistics Canada. Census Profile, 2021 Census of Population; Table 98-10-0057-01 Household income statistics by household type: Canada, provinces and territories, census divisions and census subdivisions; Table 98-10-0064-01 Total income groups by age and gender: Canada, provinces and territories, census metropolitan areas and census agglomerations with parts
<--- Return to Archive