The Economics and Statistics Division maintains archives of previous publications for accountability purposes, but makes no updates to keep these documents current with the latest data revisions from Statistics Canada. As a result, information in older documents may not be accurate. Please exercise caution when referring to older documents. For the latest information and historical data, please contact the individual listed to the right.
<--- Return to Archive
For additional information relating to this article, please contact:
June 09, 2022LIFE SATISFACTION, Q1 2022 Statistics Canada has released new data about how Canadians perceive their quality of life. This information is collected as part of the Canadian Social Survey, conducted from January 28 to March 13, 2022. This survey reports on Canadians' overall satisfaction with life, sense of meaning and purpose, loneliness, having someone on whom to depend when needed and hope for the future. National data does not include any results from the Territories.
Life satisfaction
Respondents were asked "How do you feel about your life as a whole right now?, " where 0 meant "Very dissatisfied" and 10 meant "Very satisfied."
In Nova Scotia, 49.9% of respondents rated their life satisfaction in the most satisfied categories (8-10) while 18.3% responded with the least satisfied categories (0-5). The portion reporting in the most satisfied categories were up while the portion reporting in the least satisfied categories were down compared with Q4 2021.
Across Canada, 51.7% of the respondents were in the most satisfied categories (down from Q4 2021) while 19.4% were in the least satisfied categories (little changed). Satisfaction was greatest in Prince Edward Island and Newfoundland and Labrador while it was least in Ontario and British Columbia.


Life satisfaction varied between men and women across the country. Women in British Columbia reported the least life satisfaction while women in Quebec reported the highest life satisfaction. Men in Prince Edward Island and Newfoundland and Labrador reported the highest life satisfaction. There were only small differences in life satisfaction categories among men and women in Nova Scotia.
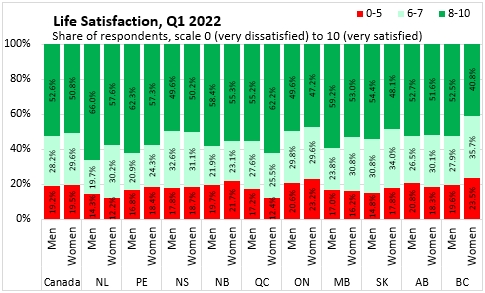
On the scale of 0-10, the average response to life satisfaction for Nova Scotia was 7.2 - the same as the national average. Average life satisfaction was the same for men and women in Nova Scotia (and nationally). Average life satisfaction was highest in Newfoundland and Labrador. Average life satisfaction responses were lower in British Columbia and Ontario.

Sense of Meaning and Purpose
Respondents were asked whether the things to do in life felt worthwhile, ranked on a scale of 0 to 10 where '0' indicated 'not at all worthwhile' and '10' indicated 'completely worthwhile'.
In Nova Scotia, 58.3% of respondents replied in the three strongest categories (8-10) for sense of meaning and purpose. This was just below the national average of 58.6%; the highest share of respondents in these categories were in Newfoundland and Labrador while the lowest were in British Columbia.
21.0% of Nova Scotians responded that their sense of meaning and purpose in the things they do in life were in the lowest categories (0-5), which was the highest share of this response among all provinces. The national average response in the lowest categories was 16.4%.

High sense of meaning and purpose was most common among women in Quebec and lowest among women in British Columbia. Low sense of meaning and purpose was more prevalent among women and men in Nova Scotia.
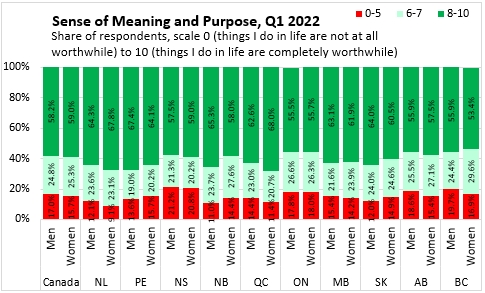
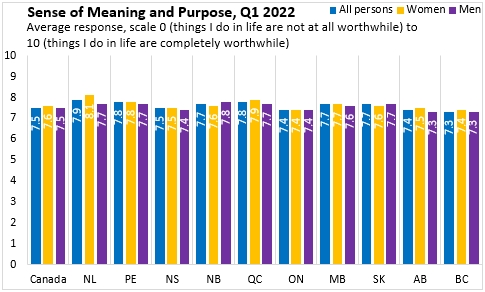
Across the country, women generally reported a higher average response than men when asked whether the things they did in life were worthwhile. Saskatchewan and New Brunswick were the exceptions.
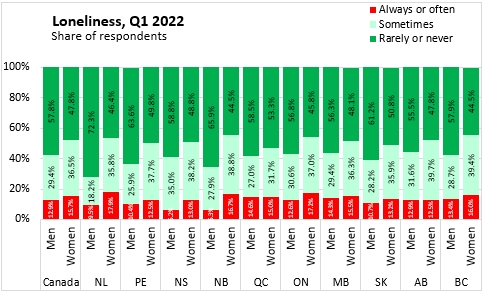
Loneliness
Survey respondents were asked about the frequency of feelings of loneliness.
In Nova Scotia, 53.6% of the population reported rarely or never feeling lonely. A further 36.7% reported feeling lonely sometimes while 9.7% reported feeling lonely often or always. Nationally, 52.7% of the population are rarely or never lonely, 33.0% are lonely sometimes and 14.3% are often or always lonely. The share of the population that are rarely or never lonely was highest in Newfoundland and Labrador and lowest in British Columbia. The share of the population reporting frequent loneliness was lowest in Nova Scotia and highest in Ontario.
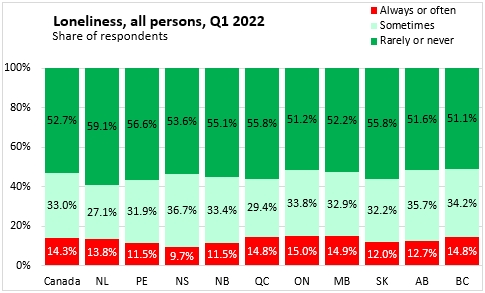
More men than women reported feeling lonely rarely or never. More women than men reported loneliness often or always. This was the case in every province.
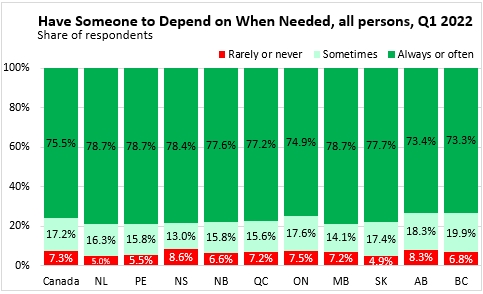
Someone to Depend on When Needed
Respondents were asked whether they felt they had someone on whom to depend when needed.
In Nova Scotia, 78.4% of the population felt they always or often had someone on whom to depend when needed. Across Canada, 75.5% of respondents felt they always or often had someone upon whom to rely (highest: Manitoba, Prince Edward Island and Newfoundland and Labrador; lowest: Alberta and British Columbia).
8.6% of Nova Scotians felt they rarely or never had someone upon whom to rely, above the national average of 7.3% (highest: Nova Scotia; lowest: Newfoundland and Labrador and Saskatchewan).
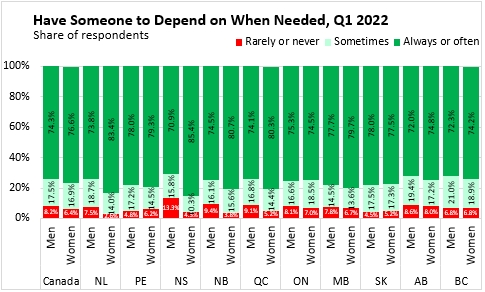
Across Canada, women in Nova Scotia reported the highest portion who always or often had someone upon whom to depend. Men in Nova Scotia were most likely to report rarely or never having someone upon whom to rely.
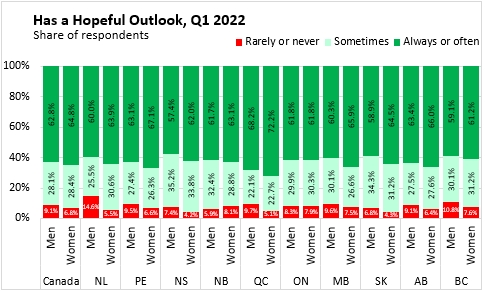
Hopeful Outlook for the Future
Respondents were asked how often they felt hopeful about the future.
Only 59.8% of Nova Scotians reported feeling hopeful about the furture always or often. This was the lowest among provinces (highest: Quebec). However, only 5.7% of Nova Scotians reported rarely or never feeling hopeful about the future - the second lowest portion among provinces (after Saskatchewan).
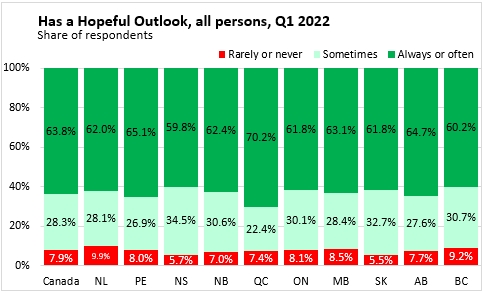
Low frequency of hopeful outlook was more prevalent among men than among women in Nova Scotia.
Source: Statistics Canada. Table 13-10-0843-01 Life satisfaction by gender and province; Table 13-10-0845-01 Sense of meaning and purpose by gender and province; Table 13-10-0847-01 Future outlook by gender and province; Table 45-10-0048-01 Loneliness by gender and province; Table 45-10-0050-01 Having someone to count on by gender and province
<--- Return to Archive