The Economics and Statistics Division maintains archives of previous publications for accountability purposes, but makes no updates to keep these documents current with the latest data revisions from Statistics Canada. As a result, information in older documents may not be accurate. Please exercise caution when referring to older documents. For the latest information and historical data, please contact the individual listed to the right.
<--- Return to Archive
For additional information relating to this article, please contact:
April 08, 2022LABOUR FORCE SURVEY: VISIBLE MINORITIES, MARCH 2022 Starting with July 2020, Statistics Canada has added a question to the Labour Force Survey asking respondents about whether they identify with visible minority populations. The population group categories of response are the same as those found in the 2016 Census: White, South Asian (e.g., East Indian, Pakistani, Sri Lankan), Chinese, Black, Filipino, Arab, Latin American, Southeast Asian (e.g., Vietnamese, Cambodian, Laotian, Thai), West Asian (e.g., Iranian, Afghan), Korean, Other.
Labour force characteristics for Indigenous populations are reported separately in the Labour Force Survey.
With the March 2022 release, Statistics Canada made some changes to reporting estimates. Data for Manitoba and Saskatchewan is now being consolidated as Prairie Region. Total population is also changed from 15 to 69 years old to 15 years and over.
This analysis will focus on conditions reported by respondents for March 2022 and year-over-year changes from March 2021. Results are not seasonally adjusted. Unless otherwise indicated, data refer to populations aged 15 an over in March 2020 and age 15-64 in March 2021. With the change in the measured population, year-over-year change should be interrupted with caution. The expanded population will typically report lower employment and participation rates with persons over the age of 65 less likely to be employed or looking for work.
March 2022
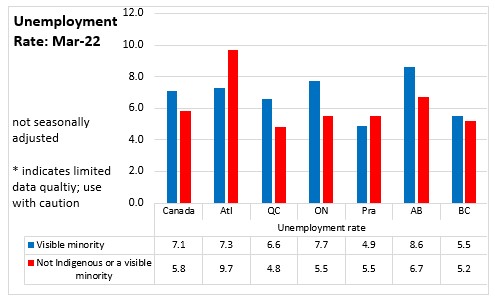
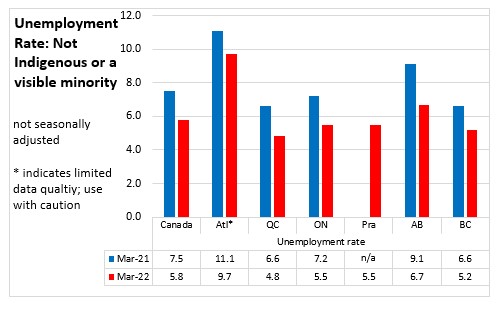
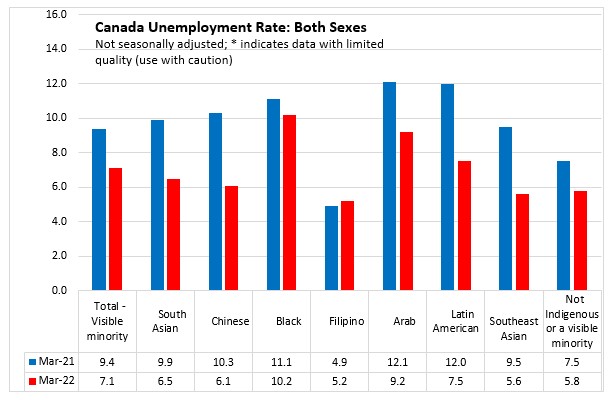
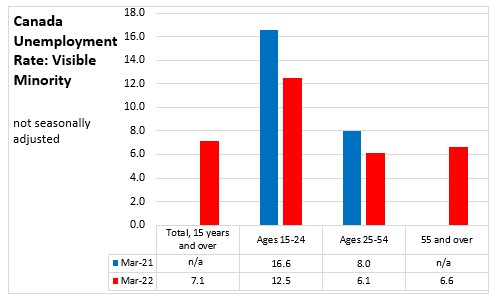
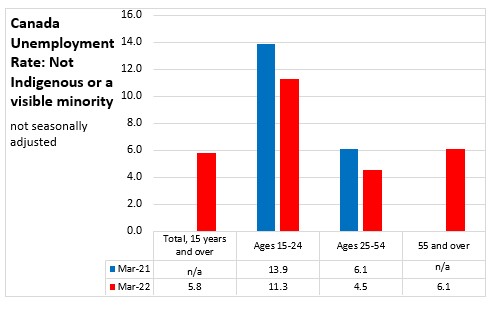
Nationally, the unemployment rate of those who identify with a visible minority population (7.1%) was higher than the unemployment rate (5.8%) of those that did not identify as Indigenous or in a visible minority population. The unemployment rate for those who identify with a visible minority group was higher than for those who did not identify as Indigenous or in a visible minority population in all regions except for Atlantic Canada and Prairies. This gap was highest in Ontario. In Atlantic Canada, the unemployment rate was 7.3% for those that identify with a visible minority group, which was 2.4 percentage points lower than for those that did not identify as Indigenous or in a visible minority population.
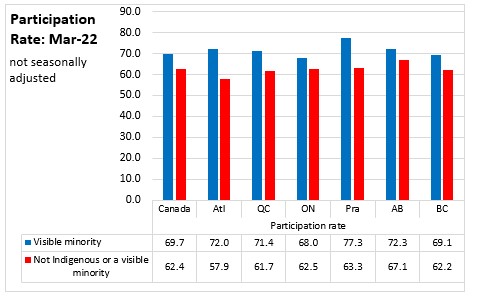
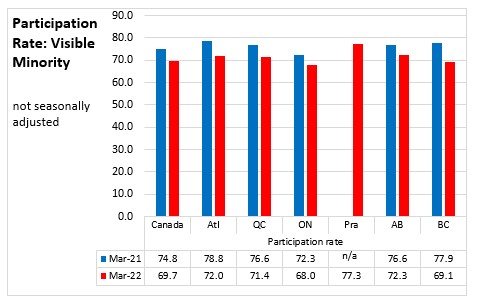
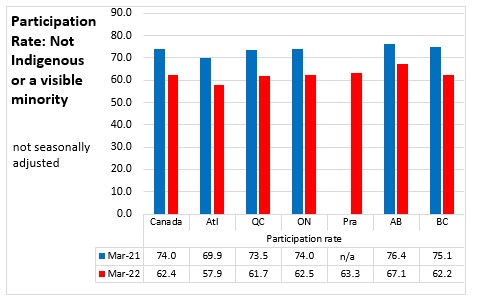
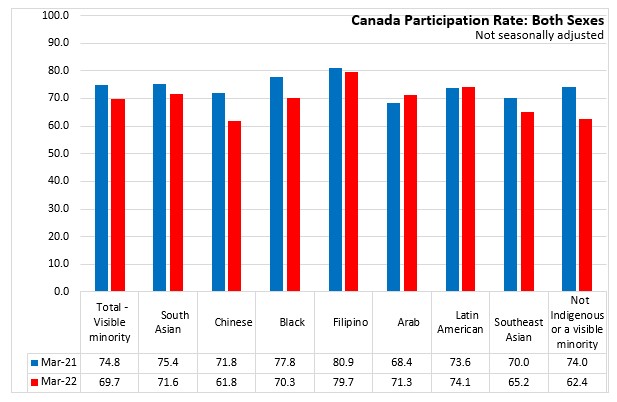
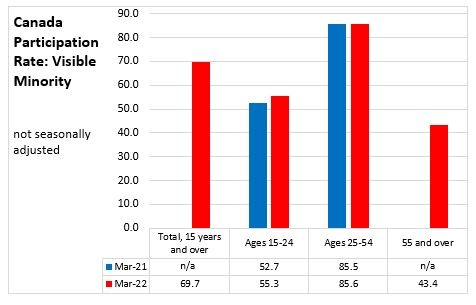
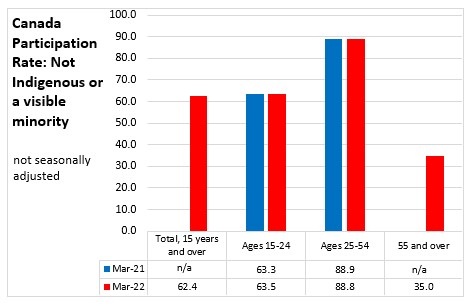
National participation rates were higher for those who identify with a visible minority population (69.7%) than for those that did not identify as Indigenous or in a visible minority population (62.4%). Participation rates of those who identify with a visible minority population were higher in all regions in March. In Atlantic Canada, those who identify with a visible minority population reported an 72.0% participation rate, compared to a 57.8 % participation rate for those that do not identify as Indigenous or in a visible minority population.
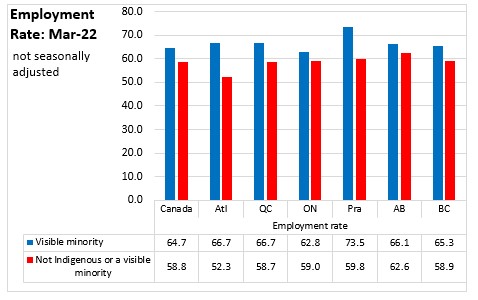
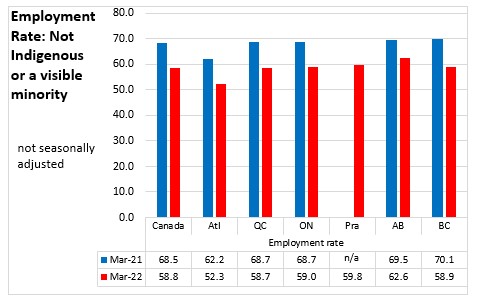
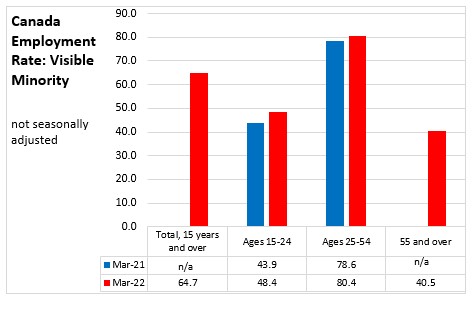
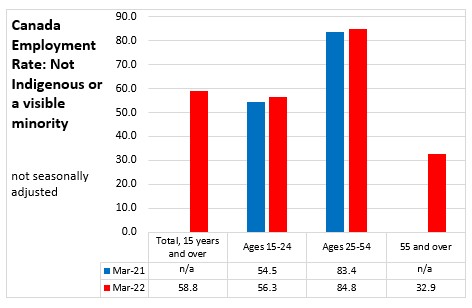
Nationally, employment rates were higher for those who identified with visible minority populations (64.7%) than for those who did not identify as Indigenous or in a visible minority population (58.8%). Employment rates were higher for those who identify with visible minority populations in every region when compared against those who do not identify as Indigenous or in a visible minority population. The gap between the employment rates for those who identified with visible minority populations and those who did not was highest in Atlantic Canada.
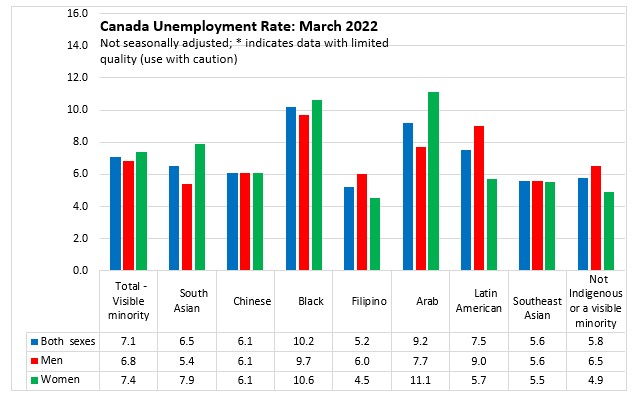
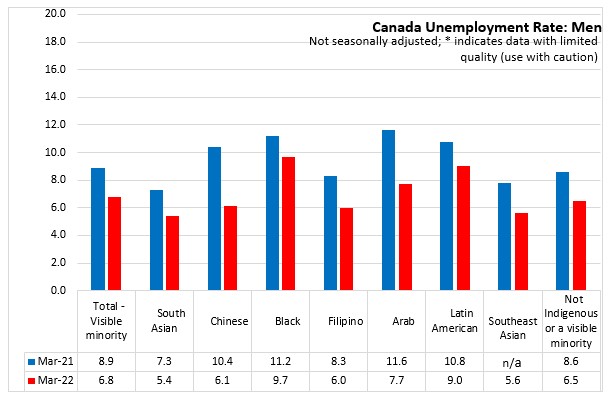
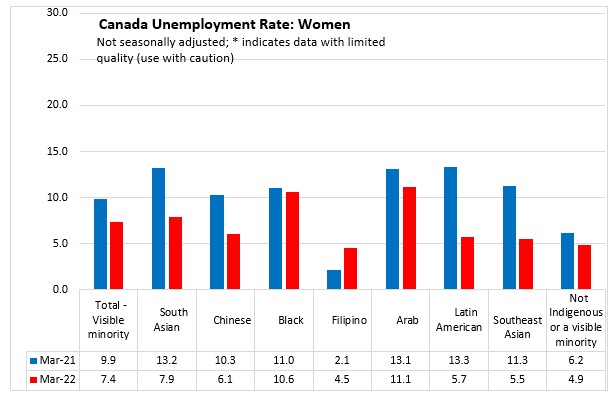
Unemployment rates were higher across almost all visible minority populations than for those who did not identify as Indigenous or in a visible minority population. The exception is among men who identify as South Asian, Filipino, Southeast Asian, Chinese and Filipino women. (Some of the results for unemployment rates have limited data quality and should be used with caution).
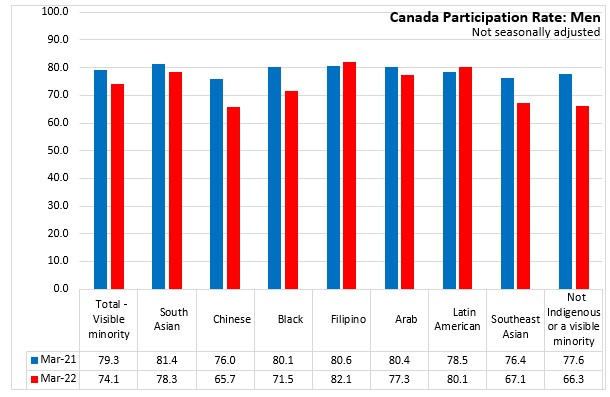
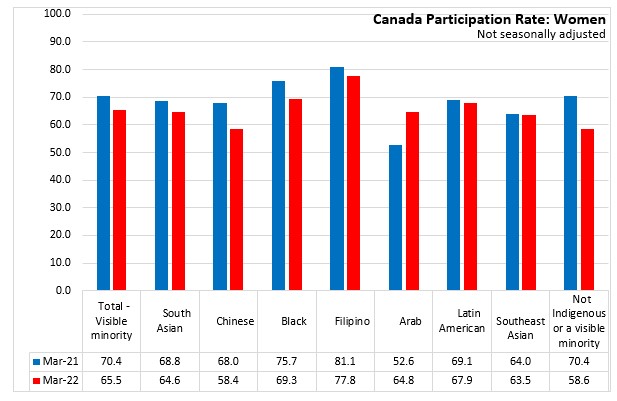
Labour force participation rates for those identifying with a visible minority was higher for men and women when compared those who do not identify as Indigenous or a visible minority. Among those that identified with specific visible minority populations, participation rates were highest among Filipino and Latin American men, and Filipino women. Participation rates among women were notably lower than among men for people who identified as South Asian, , Chinese, Arab, and Latin American.
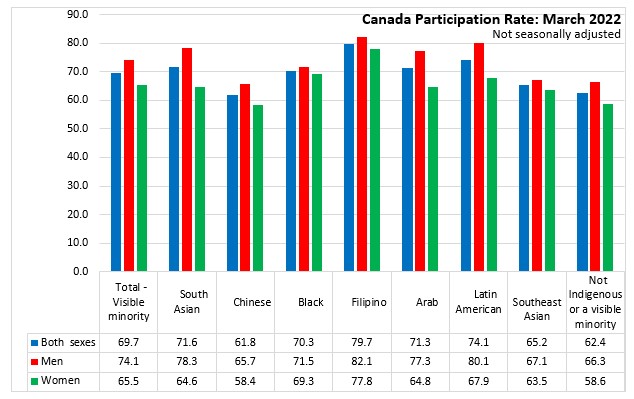
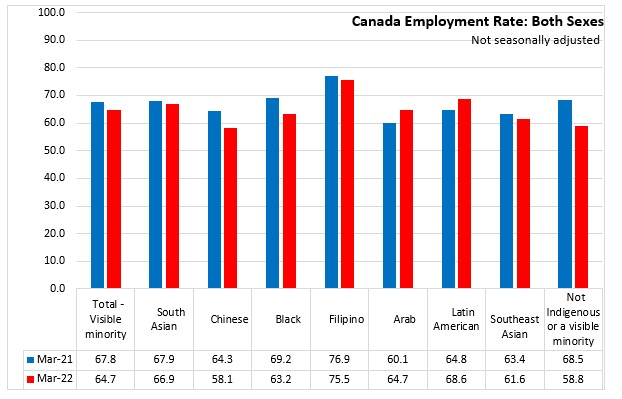
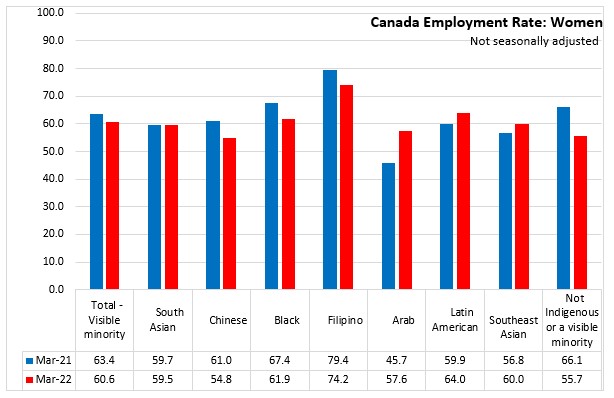
Employment rates among men and women who identify as a visible minority were generally higher than for those who do not identify as Indigenous or a visible minority. Women in all visible minority populations had lower employment rates than men, particularly where lower participation rates and higher unemployment rates were observed.

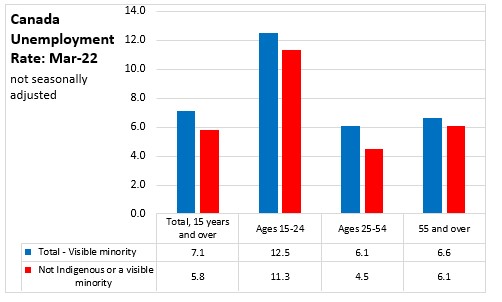
Unemployment rates in Canada were higher for all age cohorts of visible minority populations, when compared with those that do not identify as Indigenous or in a visible minority population.
Participation rates of visible minority populations were higher for older workers, compared to the same age cohort that does not identify as Indigenous or visible minority populations. Among youth and core aged workers, participation rates among visible minority populations were lower than among similarly-aged populations that do not identify as Indigenous or in a visible minority population.
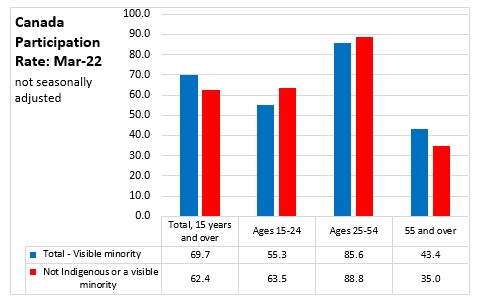
With lower participation and higher unemployment rates, employment rates were lower for visible minority youth and core aged populations. With stronger participation rates (and despite higher unemployment rates), the employment rate of older visible minority populations was higher than older Canadians who do not identify as Indigenous or in a visible minority population.

Year-over-Year Change (March 2022 vs March 2021)
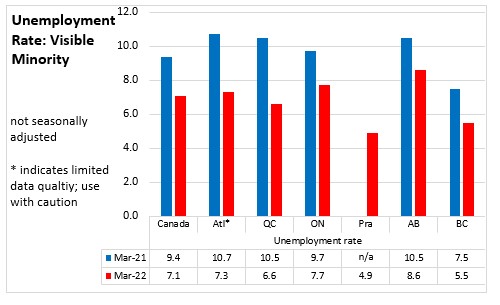
Nationally, the unemployment rate among those who identify as visible minority populations declined from 9.4% in March 2021 to 7.1% in March 2022. All regions reported declines in visible minority population unemployment rates when compared to the previous year, with the largest decline in Quebec. March 2021 data was not available for the Prairie region.
The unemployment rate among Canadians who do not identify as Indigenous or in a visible minority population also declined from 7.5% in March 2021 to 5.8% in March 2022. All regions reported declines in unemployment rates among those that do not identify as Indigenous or in a visible minority population from a year earlier.
Participation rate among Canadians who identify as a visible minority declined from 74.8% in March 2021 to 69.7% in March 2022. Participation rates among visible minority populations were lower when compared to the previous year across all regions. Nationally, participation rates among those who do not identify as Indigenous or in a visible minority population declined from 74.0% in March 2021 to 62.4% in March 2022 with declines in all regions.
Employment rates among Canadians who identify as a visible minority population declined 3.1 percentage points from a year earlier to 64.7% in March 2022. All regions reported declined in employment rates of visible minority populations. Employment rates among Canadians who do not identify as Indigenous or in a visible minority population declined 9.7 percentage points from a year earlier to 58.8% in March 2022. There were declines in all regions.

Unemployment rates across all visible minority populations except Filipino were lower in March 2022 when compared to a year earlier. Unemployment rates among both men and women visible minority populations also declined from the previous year with the exception of Filipino women.
Participation rate among all visible minority population groups, except Arab and Latin American, declined year-over-year in March 2022. Among men, year-over-year participation rates increased among those who identify as Filipino and Latin American. Among women, year-over-year participation rates were higher for those who identify as Arab in March 2022.
Employment rates across visible minority groups generally declined year-over-year in March 2022 except Arab and Latin American groups. Employment rate among men who identify as Filipino, Arab and Latin American were higher when compared to the previous year. Arab and Latin American women saw their employment rates increase from a year earlier.

Year-over-year analysis is not available for total population and older workers due to the change in data reporting.
Unemployment rate among visible minority populations declined from the previous year for youth and core aged workers. The same trend was visible among those who do not identify as Indigenous or a visible minority.
Participation rate of visible minority populations increased year-over-year for youth and core-aged workers. Participation rates among those who do not identify as Indigenous or in a visible minority population increased slightly for youth and declined slightly for core-aged workers.
Employment rates of visible minority populations increased year-over-year across youth and core-aged workers. The same trend occurred for those who do not identify as Indigenous or in a visible minority population.
Source: Statistics Canada. Table 14-10-0373-01 Labour force characteristics by visible minority group, three-month moving averages, monthly, unadjusted for seasonality
<--- Return to Archive