The Economics and Statistics Division maintains archives of previous publications for accountability purposes, but makes no updates to keep these documents current with the latest data revisions from Statistics Canada. As a result, information in older documents may not be accurate. Please exercise caution when referring to older documents. For the latest information and historical data, please contact the individual listed to the right.
<--- Return to Archive
For additional information relating to this article, please contact:
March 31, 2022HOUSEHOLD ACTUAL FINAL CONSUMPTION, 2020 Statistics Canada's system of macroeconomic accounts measures household final consumption based on purchases of final goods and services from market sources by households. Household actual final consumption expenditures expand this to include the value of goods and services provided to households in kind by governments and non-profit institutions.
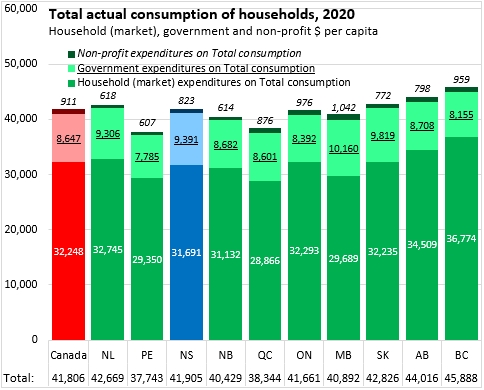
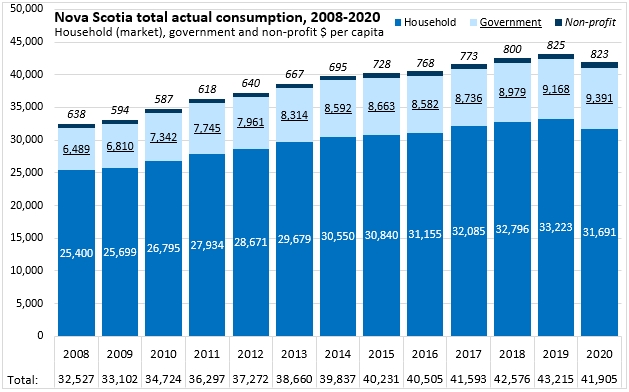
In 2020, household final consumption expenditures on market goods and services amounted to $31,691 per capita in Nova Scotia. Nationally, per capita household final consumption expenditures on market goods and services were $32,248 - ranging from a high of $36,744 in British Columbia to a low of $29,350 in Prince Edward Island.
The value of government services added $9,391 per capita to household consumption in Nova Scotia while non-profit institutions added $823 per capita. Across Canada, government expenditures added $8,647 to per capita household consumption while non-profits added a total of $911. Government expenditures for households was highest in Manitoba at $10,160 per capita and lowest in Prince Edward Island at $7,785 per capita. Non-profit expenditures for households were highest in Manitoba ($1,042 per capita) and were lowest in Prince Edward Island ($607).
Household actual final consumption in Nova Scotia (including market, government and non-profit) amounted to $41,905 per capita, which was $99 more than the national average of $41,806 per capita. The highest household actual final consumption was in British Columbia at $45,888 and lowest in Prince Edward Island at $37,743.
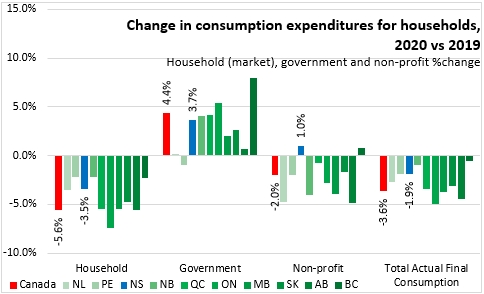
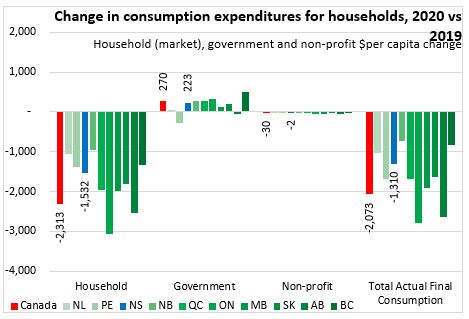
Compared with 2019, the value of total actual household consumption expenditures fell by 1.9% in Nova Scotia and by 3.6% nationally. Most of the decline was accounted for by falling household consumer expenditures and non-profit expenditures (except Nova Scotia and British Columbia), which were affected by the COVID-19 pandemic. These declines were offset by rising government expenditures for households, which were up in all provinces except Prince Edward Island.
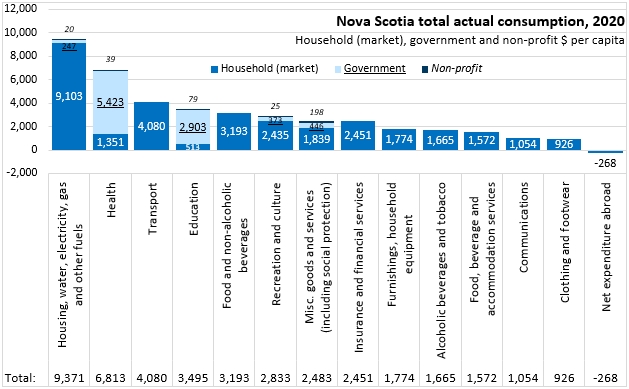
Looking across all household consumption categories in Nova Scotia, housing and utilities was the largest expenditure category. Most of these expenditures were market-based expenditures by households themselves, with small additions from government and non-profit expenditures on behalf of Nova Scotia households. Health care, transportation, education and food were the next largest categories of total actual household consumption. The bulk of health and education expenditures on behalf of Nova Scotia households were made by governments while food and transportation were entirely household expenditures. There were smaller government and non-profit contributions to recreation and culture expenditures as well as miscellaneous goods and services (including social protection). All the smaller categories of household final consumption were made entirely by households.
Nova Scotia's actual consumption expenditure growth accelerated from 2016-2019 before declining during the first waves of COVID-19 in 2020.
Non-market expenditures that benefit households fall into a few different categories: health, educaiton, recreation/culture, housing and miscellaneous (including social protection).
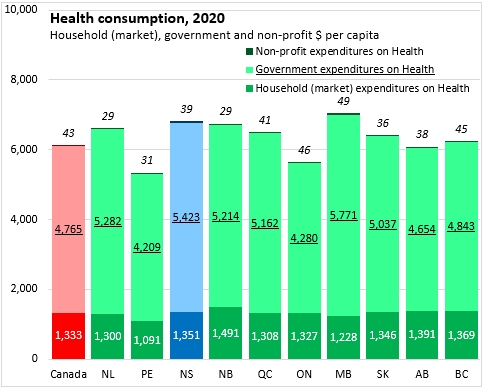
The largest non-market expenditures that benefit households were government expenditures on health. Health spending by governments is considerably larger than private, market-based expenditures on health care for households.
Nova Scotia's government expenditure for household health amounted to $5,423 per capita in 2020 - second highest in the country after Manitoba at $5,771. National government health expenditures for households were $4,765 per capita. The lowest government expenditures for household health were in Prince Edward Island at $4,209 per capita.
Non-profit expenditures on health for households were comparatively small at $39 per capita. National non-profit health expenditures for households were $43 per capita in 2020 (highest: Manitoba; lowest: New Brunswick).
Combining market, government and non-profit health expenditures for households, Nova Scotia had the second highest household health expenditures per capita after Manitoba. The lowest expenditures were in Prince Edward Island.
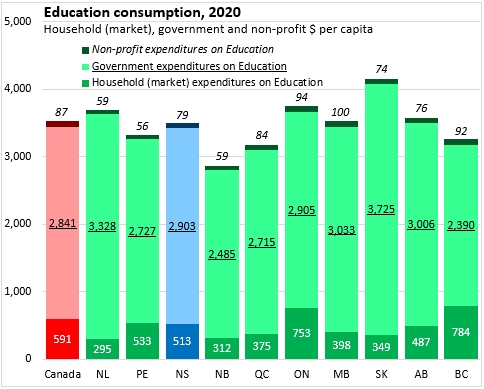
Education expenditures were the second largest category of non-market spending that benefitted households. Nova Scotia's government education expenditures for households were $2,903 per capita (considerably larger than the $513 per capita in market expenditures). National government education expenditures for households were $2,841 per capita with a high of $3,725 in Saskatchewan and a low of $2,390 in British Columbia.
As with health care, non-profit education expenditures for households were smaller at $87 per capita nationally and $79 per capita in Nova Scotia.
Household actual final consumption on education (funded by all sources) were highest in Saskatchewan and lowest in New Brunswick.
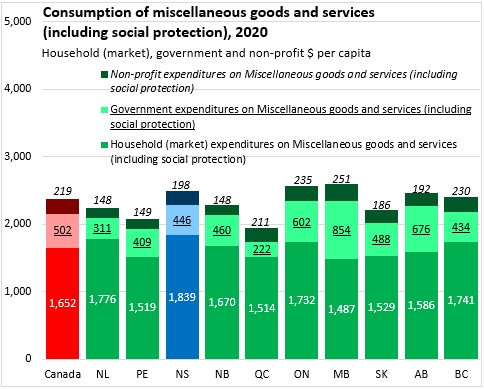
The next three largest categories of non-market expenditures for households were miscellaneous (including social protection), recreation/culture and housing/utilities. In all three, market household final consumption expenditures were much larger than government and non-profit expenditures serving households.
Government expenditures on miscellaneous/social protection amounted to $446 per capita in Nova Scotia in 2020 ($502 per capita nationally) while non-profit expenditures amounted to $198 per capita in 2020 ($219 per capita nationally).
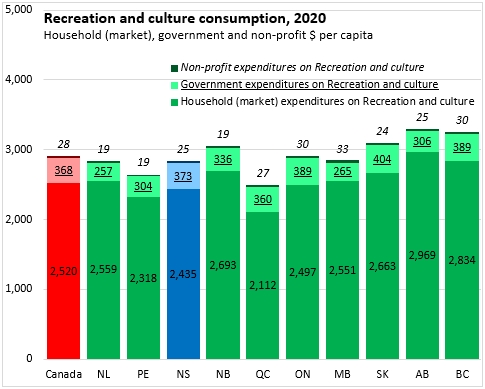
Recreation and culture expenditures by governments for households amounted to $373 per capita in Nova Scotia in 2020; non-profit expdenditures were $25 per capita. These were considerably less than the $2,435 in household expenditures in the market for recreation and culture. Nationally, government recreation and culture expenditures for households were $368 per capita; non-profit expenditures were $28 per capita and private market expenditures were $2,520.
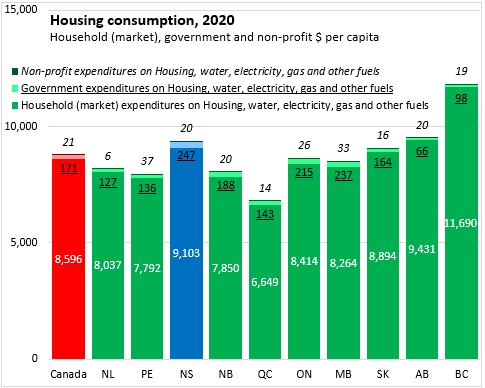
Housing consumption expenditures (including water and energy) were overwhelmingly private market expenditures in 2020 - ranging from $6,649 per capita in Quebec to $11,690 per capita in British Columbia. Nova Scotia household market spending on housing/utilities was $9,103 per capita, which were the third highest after British Columbia and Alberta. Government housing/utilities expenditures for households was $247 per capita in Nova Scotia in 2020 ($171 per capita nationally). Non-profit housing/utilities expenditures for households were $20 per capita in Nova Scotia in 2019 ($21 per capita nationally).
Notes: Household actual final consumption consists of the consumption of goods and services by households. The value of household actual final consumption is given by summing the following three components:
- The value of household expenditures on consumption of goods or services including expenditures on non-market good or services sold at prices that are not economically significant
- The value of the expenditures incurred by government units on individual consumption of goods or services provided to households as social transfers in kind
- The value of the expenditures incurred by non-profit institutions serving households on individual consumption of goods or services provided to households as social transfers in kind.
Source: Statistics Canada. Table 17-10-0005-01 Population estimates on July 1st, by age and sex; Table 36-10-0609-01 Household actual final consumption, Canada, provincial and territorial, annual (x 1,000,000)
<--- Return to Archive