The Economics and Statistics Division maintains archives of previous publications for accountability purposes, but makes no updates to keep these documents current with the latest data revisions from Statistics Canada. As a result, information in older documents may not be accurate. Please exercise caution when referring to older documents. For the latest information and historical data, please contact the individual listed to the right.
<--- Return to Archive
For additional information relating to this article, please contact:
October 26, 2021HOUSEHOLD INCOME, CONSUMPTION AND WEALTH, Q2 2021 As part of its new quarterly data for Distribution of Household Economic Accounts, Statistics Canada is now providing quarterly data on household income, household final consumption expenditures and household wealth. This information is available for provinces as well as for income quintiles and age groups.
These quarterly results supplement previously-available provincial data for compensation of employees and investment in fixed capital stock. These concepts align with the Provincial and Territorial Economic Accounts, but they remain subject to revision in future releases.
Household Income
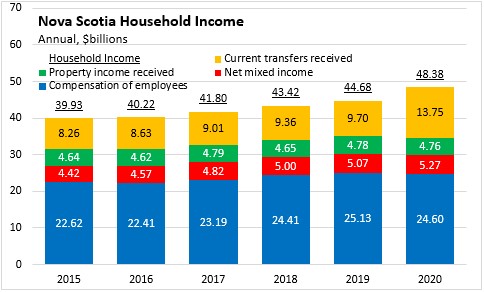
In addition to compensation of employees, household income also includes net mixed income (generated from unincorporated businesses), property income received (generated as the result of ownership of assets) and current transfers received (generally from government).
In 2019, (prior to the COVID-19 pandemic), Nova Scotia's household income was $44.68 billion. There was $25.13 billion in employee compensation, $5.07 billion in net mixed income, $4.78 billion in property income received and $9.70 billion in current transfers received.
In 2020, Nova Scotia compensation of employees declined by over $700 million (-2.1%) with large employment losses during periods of restrictions to contain COVID-19. Net mixed income increased by $200 million (4.0%) while property income received was little changed. With new federal transfers to compensate for income losses incurred during COVID-19 restrictions, current transfers received by Nova Scotians grew by just over $4 billion (41.8%). Overall household income increased by 8.3% for Nova Scotia in 2020.
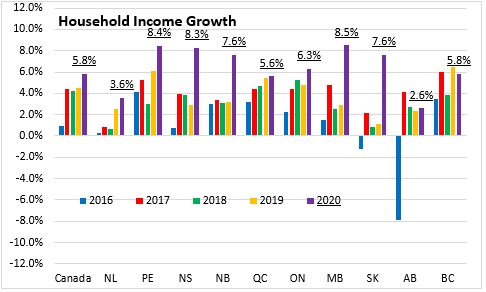
Rising transfer income accelerated household income growth for all provinces except British Columbia in 2020.
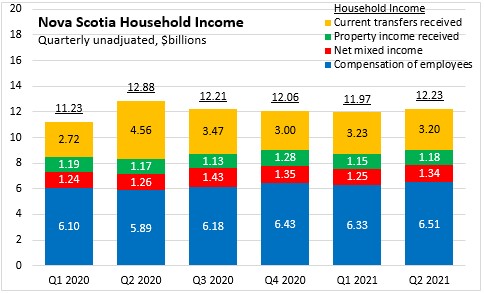
Nova Scotia's compensation of employees contracted in Q2 2020 but returned to pre-COVID levels thereafter (Q1 2020, quarterly data is only available at a provincial level starting in 2020). Current transfers remained elevated from Q2 2020 to Q2 2021.
In 2020, employee compensation fell in every province (although the decline in Ontario was modest). Nova Scotia's decline of 2.1% exceeded the national average of 1.5%. Newfoundland and Labrador and Alberta reported the largest declines in employee compensation; Ontario and Manitoba reported the smallest declines.

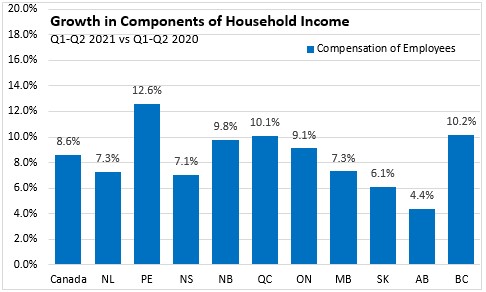
Through the first half of 2021 (compared with the same period in 2020), employee compensation grew by 7.1% in Nova Scotia. National compensation grew the fastest in Prince Edward Island and the slowest in Alberta.
Despite the pandemic and its impact on many businesses, net mixed income (household income generated primarily through ownership of unincorporated businesses) was up for all provinces, including a 4.0% gain in Nova Scotia. The national average increase in net mixed income was 2.7%. Growth was faster in Quebec and the Maritimes and slower in Alberta and Newfoundland and Labrador.
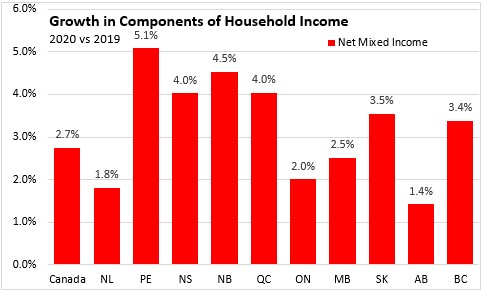
Net mixed income has continued to grow in 2021, up by 3.5% in Nova Scotia over the first half of the year (compared with the same period in 2020). National net mixed income was up 5.9% across Canada with faster growth in Quebec and slower growth in Alberta.

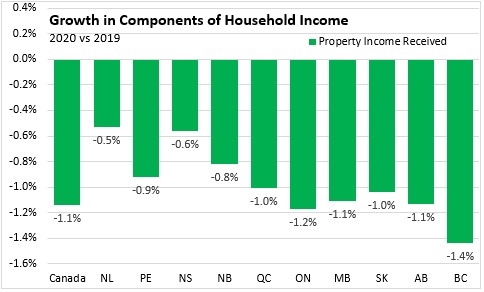
In 2020, property income (derived from ownership of assets) was down in all provinces. Nova Scotia's property income was down 0.6%, which was less of a decline than the national average of 1.1%. Property income was down the most in British Columbia and the least in Newfoundland and Labrador.
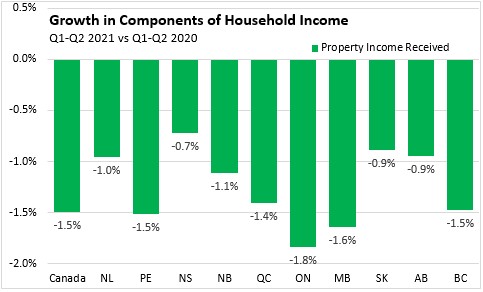
So far in 2021, property income continues to decline, falling by 0.7% in Nova Scotia (least decline among provinces) and 1.5% nationally. The decline in property income to date in 2021 has been largest in Ontario.
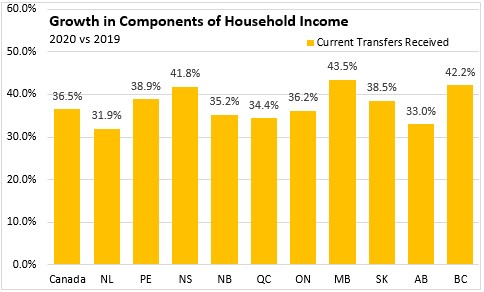
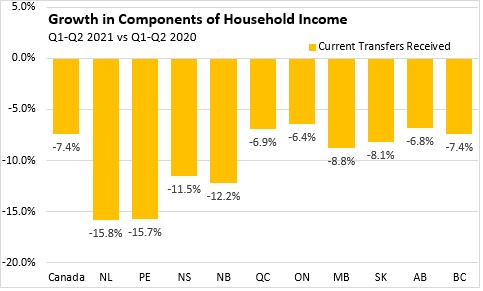
The imposition of restrictions to control the COVID-19 pandemic in 2020 was swiftly followed by several large Federal and Provincial government support programs to maintain income during a period of historic employment loss. In 2020, current transfers received increased by 41.8% in Nova Scotia and by 36.5% nationally. The largest gains were in Manitoba and British Columbia, while the smallest were in Newfoundland and Labrador and Alberta.
Improving economic conditions in 2021 has allowed many emergency transfer arrangements to be wound down. Through the first half of 2021, current transfers received were down 11.5% in Nova Scotia and 7.4% nationally. Transfers have declined more in Atlantic Canada. The least declines in transfers were in Ontario, Alberta and Quebec.
The addition of substantial transfer income boosted Nova Scotia's overall household income by 8.3%, offsetting the declines from compensation of employees and property income. National household income was up 5.8% wwith the fastest gains in Manitoba and Prince Edward Island. Household income growth in 2020 was slowest in Alberta and Newfoundland and Labrador.

Through the first two quarters of 2021, household income was up 0.3% in Nova Scotia as declining transfers and property income were offset by recovery in employee compensation and continued growth in net mixed income. Household income growth was 3.4% nationally with faster growth in Quebec, Ontarion and British Columbia. Newfoundland and Labrador was the only province to report falling household income in the first half of 2021.

Household Final Consumer Expenditures
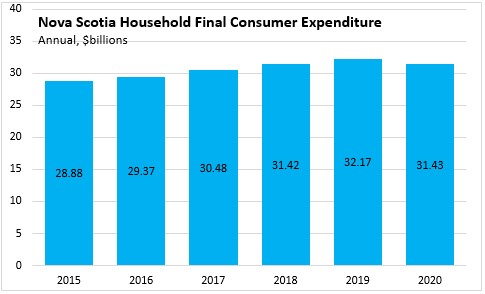
Nova Scotia's household final consumer expenditures grew to over $32 billion in 2019. With the imposition of restrictions on retail and service operations in 2020, consumer spending declined by over $700 million (-2.3%).
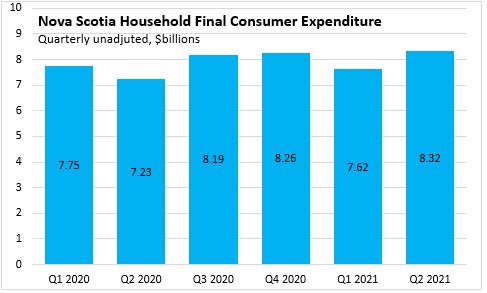
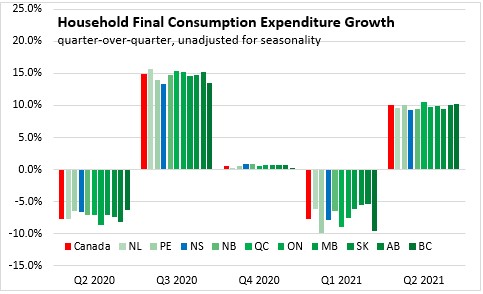
Nova Scotia's household final consumer expenditures fell in Q2 2020 but rebounded in Q3 and Q4 of 2020. After a dip in Q1 2021 (which may be attributable to seasonal consumption patterns), Nova Scotia's consumer spending increased to over $8.3 billion in Q2 2021.
In 2020, Nova Scotia, Prince Edward Island and British Columbia reported less of a decline in consumer spending. National consumer spending fell by 5.3% with sharper declines in Ontario as well as the prairie provinces.

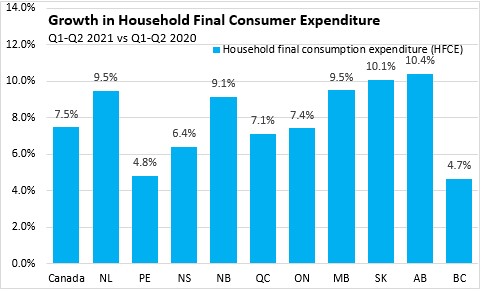
Through Q2 of 2021, consumer spending was up for all provinces. Nova Scotia's consumer spending grew by 6.4% compared to the first two quarters of 2020. Consumer spending increased fastest in Alberta and Saskatchewan. The slowest growth was reported in British Columbia and Prince Edward Island (whose consumer spending did not fall as far in 2020).
Quarterly consumption spending fell significantly in Q2 2020 for all provinces. All provinces reported sharp rebounds in Q3 2020 as well as smaller gains in Q4 2020. Consumer spending fell again in Q1 2021 before rebounding in Q2 2021 (these data are not adjusted for seasonal patterns).
Household Assets, Liabilities and Net Worth
Despite employment shocks and instability over the pandemic, household net worth has continued to grow. Net worth is the excess of asset values over financial liabilities.
In Q2 2021, Nova Scotia's net worth per household rose to over $657,000. This was below the national average net worth ($920,000 per household). Net worth was highest in British Columbia and Ontario. New Brunswick reports the lowest household net worth.

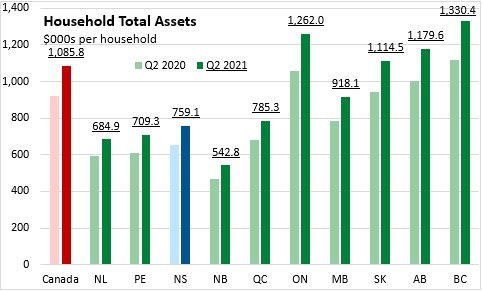
Nova Scotia's total assets per household amounted to $759,100 in Q2 2021. National assets per household were almost $1,089,000. Assets per household exceeded $1 million in British Columbia, Ontario, Alberta and Saskatchewan. New Brunswick reported the lowest assets per household.
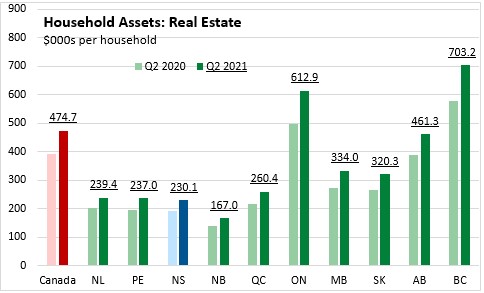
Real estate assets made up a substantial portion of assets in British Columbia and Ontario. Real estate assets per household were lower in Atlantic Canada and Quebec.
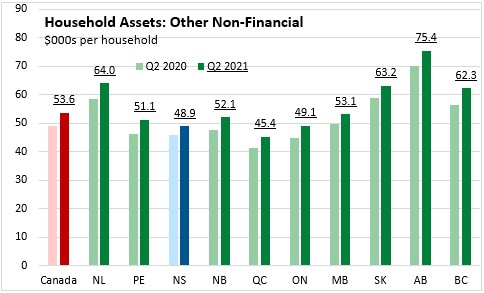
Other non-financial assets were higher in Alberta, Newfoundland and Labrador, Saskatchewan and British Columbia.
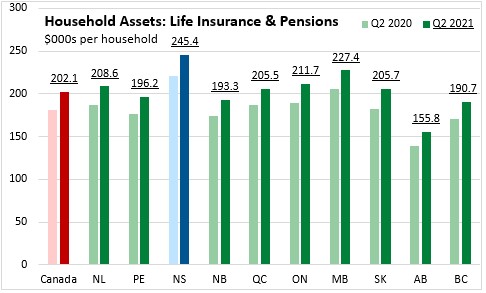
Nova Scotia's average life insurance and pension assets per household were higher than in any other province in Q2 2021. Only in Nova Scotia and New Brunswick do life insurance and pension assets per household exceed real estate assets.
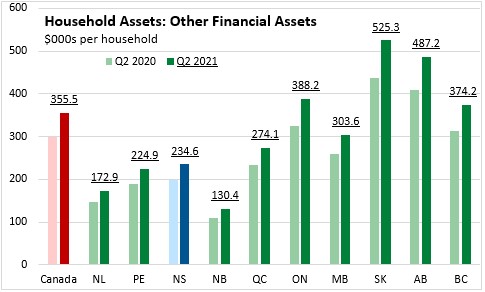
In Saskatchewan and Alberta, other financial assets per household exceed the value of real estate as well as the value of life insurance and pensions.
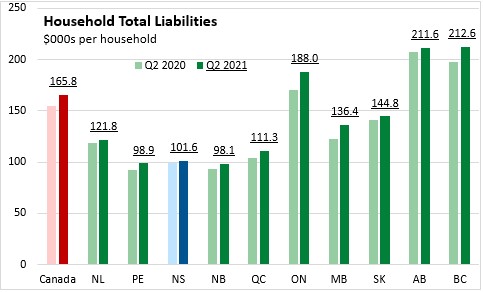
Across Canada, average per household financial liabilities amounted to $165,800. Nova Scotia ($101,600) and the other Maritime provinces reported the lowest financial liabilities. The highest financial liabilities were observe in British Columbia and Alberta.
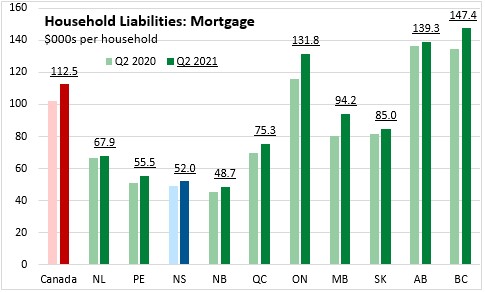
Mortgage liabilities typically make up the largest portion of financial liabilities. Mortgage liabilities were lower in the Maritimes ($52,000 per household in Nova Scotia) and higher in British Columbia, Alberta and Ontario.
Non-mortgage financial liabilities per household were higher in Alberta and British Columbia and lower in Quebec and Manitoba.

Source: Statistics Canada. Table 36-10-0663-01 Distributions of household economic accounts, income, consumption and saving, Canada, provinces and territories, quarterly (x 1,000,000); Table 36-10-0661-01 Distributions of household economic accounts, wealth, Canada, regions and provinces, quarterly (x 1,000,000)
<--- Return to Archive