The Economics and Statistics Division maintains archives of previous publications for accountability purposes, but makes no updates to keep these documents current with the latest data revisions from Statistics Canada. As a result, information in older documents may not be accurate. Please exercise caution when referring to older documents. For the latest information and historical data, please contact the individual listed to the right.
<--- Return to Archive
For additional information relating to this article, please contact:
August 11, 2021CANADIAN HOUSING STATISTICS PROGRAM, PROPERTIES SOLD IN 2018 Statistics Canada released new data today from the Canadian Housing Statistics Program (CHSP) which provide insight into the household characteristics of property owners in Nova Scotia, New Brunswick, and British Columbia. Today’s release is the first of a three-part series that looks at the properties sold from January 1 to December 31, 2018 and the characteristics of their buyers.
The article provides insight on the geographic distribution, property type, sale price and living area of properties sold. This information could also serve as a point of comparison to understand the impacts of COVID-19 pandemic on the housing market.
The information provided in this article is focused on properties transacted as part of market sales, which are transactions where properties are sold in an arm's length transfer of ownership, that is, by unrelated parties.
Among the provinces with data available in this release, British Columbia had the highest share of properties sold out of the provincial residential property stock, comprising almost 8% of all properties in the province, followed by Nova Scotia (5.7%) and New Brunswick (5.2%).
Non-market sales of residential properties include sales to related parties or sales of special interest, forfeitures and foreclosures. In 2018, New Brunswick (31.7%) had the highest share of non-market sales followed by Nova Scotia (29.1%) and British Columbia (24.5%).

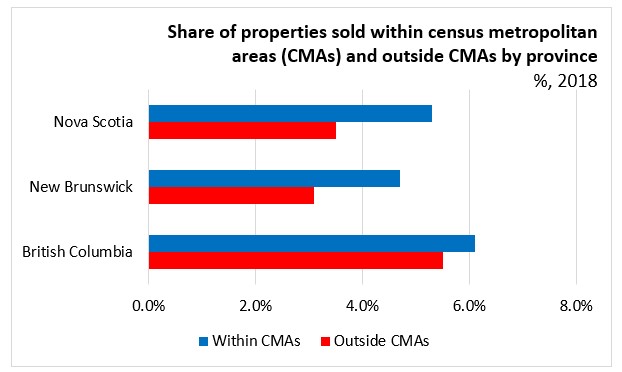
In all three provinces, residential market sales was higher in the census metropolitan areas (CMA) compared with outside of CMAs. Nova Scotia had the largest difference with 5.3% of residential properties being sold in the Halifax CMA compared with 3.5% outside the CMA. Kelowna (7.8%) in British Columbia had the highest share of residential property sales among the CMAs of all three provinces.
While single-detached houses had the highest number of sales in all three provinces, these sales accounted for a smaller share of their respective stock when compared to other property types.
Semi-detached houses, row houses and condominium apartments had the highest share of residential properties sold in all three provinces in 2018. The difference in sales was largest in New Brunswick where 10.1% of semi-detached houses were sold compared with 3.4% of single-detached houses.
In Nova Scotia, row houses (7.7%) had the highest share followed by condominium apartments at 7.4%. This compared with 4.0% of single-detached houses that were sold in 2018.

The median price of properties sold was highest in British Columbia ($535,000) which was over three times that of Nova Scotia ($167,000) and almost four times the price in New Brunswick ($134,000). The price difference was most pronounced in vacant land properties. The median price of vacant properties in British Columbia was $220,000 compared with the median price of $25,000 in Nova Scotia and $15,000 in New Brunswick in 2018.
In Nova Scotia, condominium apartments had the highest median price at $215,000 compared with $192,000 for single-detached houses.

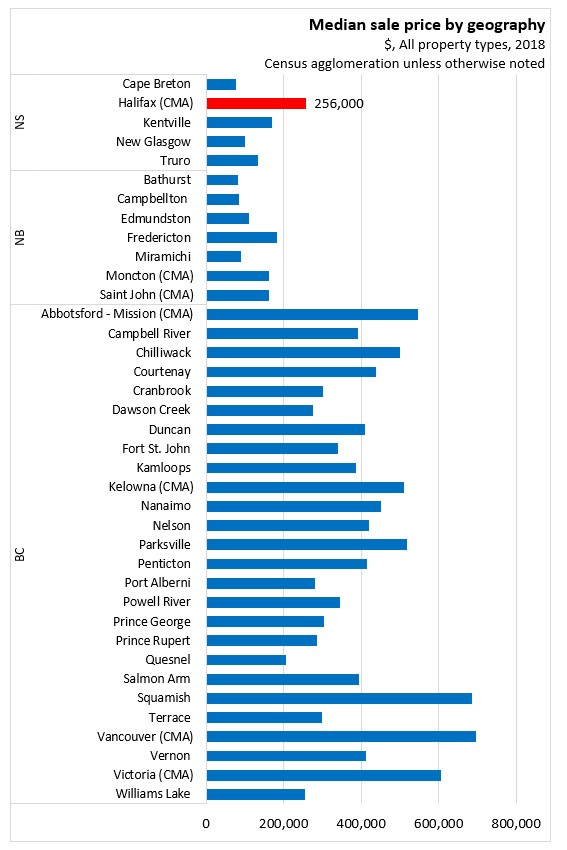
In all three provinces, properties within CMAs typically had higher median prices relative to properties outside of CMAs. The difference was highest in Nova Scotia, where the median price of properties in the Halifax CMA was $256,000 in 2018. The Vancouver CMA had the highest median sale price at $695,000 among all CMAs in 2018.
In 2018, properties sold in Nova Scotia and New Brunswick had larger living areas compared with properties that were not sold. In Nova Scotia, the median living area of sold properties was 1,510 square feet (sf) compared to 1,350 sf for properties that were not sold. Properties sold in the Halifax CMA had a median living area of 1,810 sf while properties not sold had a median living area of 1,670 sf.
In Nova Scotia, the price per square foot of sold properties was $125 per sf compared with $106 per sf for properties sold in New Brunswick.
The median price for properties sold within the Halifax CMA was $151 per sf while the median price for properties sold outside the CMA was $102 per sf.
In New Brunswick, the median price per square foot of properties sold was relatively uniform. The median price per square foot of properties sold in Saint John was $107 per sf compared with the median price of $103 per sf for both properties sold in Moncton and outside the CMAs.
Statistics Canada noted that part two of this series will analyze the characteristics of the buyers, including sex, family composition, first-time home buyers and immigration status. Part three will examine the income of buyers relative to the sale price of the properties they purchased, with a focus on price-to-income ratios by geography, property type and income quintile.
Source: Statistics Canada, Residential real estate sales in 2018: Characteristics of properties sold; Table 46-10-0057-01: Number of residential properties sold and sale price by property type and period of construction
<--- Return to Archive