The Economics and Statistics Division maintains archives of previous publications for accountability purposes, but makes no updates to keep these documents current with the latest data revisions from Statistics Canada. As a result, information in older documents may not be accurate. Please exercise caution when referring to older documents. For the latest information and historical data, please contact the individual listed to the right.
<--- Return to Archive
For additional information relating to this article, please contact:
July 23, 2021FOOD SERVICES AND DRINKING PLACES, MAY 2021 Renewed COVID-related restrictions were imposed in Nova Scotia on April 28; restaurants and licensed establishments were closed for dine-in service (contactless take-out and delivery remained available).
With May reference month results, year-over-year (May 2021 vs May 2020) and year-to-date (Jan-May21 vs Jan-May20) comparisons show rebounds from the unprecedented declines observed in the first wave of the COVID-19 pandemic.
Month-over-Month (May 2021 vs Apr 2021, seasonally adjusted)
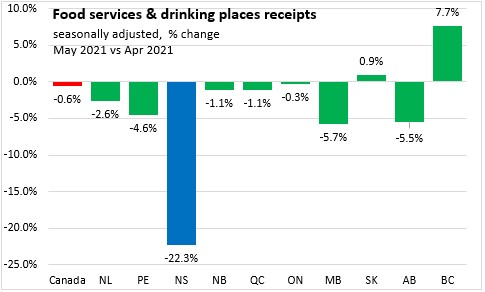
With the imposition of new restrictions on bar and restaurant services at the end of April, Nova Scotia's food services and drinking places receipts decreased 22.3% to $98.1 million. Canada's food services and drinking places receipts decreased 0.6% to $4.4 billion. Only two provinces reported monthly increases in food services and drinking places, with British Columbia (7.7%) reporting the largest gain, and Nova Scotia (-22.3%) reporting the largest decline in percentage terms.
Year-over-Year (May 2021 vs May 2020, seasonally adjusted)
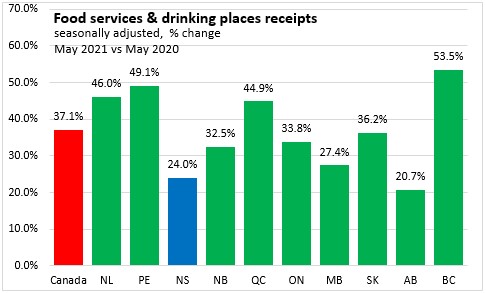
Despite reductions associated with new restrictions in place for May 2021, Nova Scotia food services and drinking places receipts were up 24.0% compared with the same month in 2020, when restrictions associated with the first wave of COVID-19 were in place. Canada's food services and drinking places receipts increased 37.1%. All provinces reported year-over-year increases in food services and drinking place receipts, with British Columbia (53.5%) reporting the largest gain and Alberta (20.7%) reporting the smallest gain in percentage terms.
Year-to-Date (Jan-May 2020 vs Jan-May 2021, seasonally adjusted)
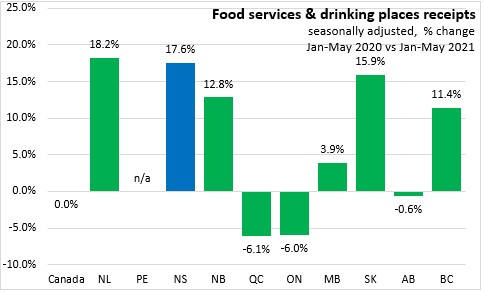
Nova Scotia food services and drinking places receipts increased 17.6% ($92.2 million). Canada's food services and drinking places receipts were little changed (-$1.7 million, -0.01%). Six provinces reported year-to-date increases in food services and drinking place receipts, with Newfoundland and Labrador (18.2%) reporting the largest gain and Quebec (-6.1%) and Ontario (-6.0%) reporting the largest declines in percentage terms.
Prince Edward Island food services and drinking places receipts were unavailable for March and April 2020, so no year-to-date comparisons are made.
Nova Scotia Sales by Establishment Type (Jan-May 2020 vs Jan-May 2021, unadjusted)
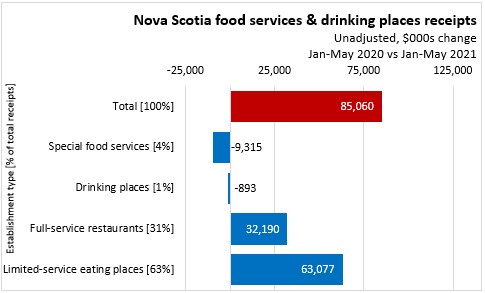
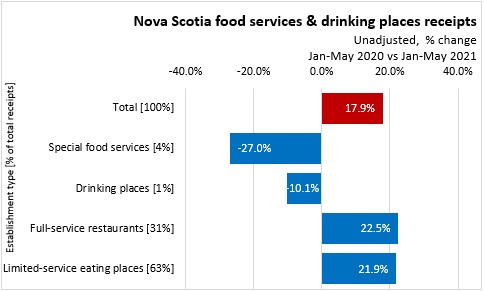
Note: data for special food services and for drinking places were imputed for some months during which limited data were available.
Limited-service eating places and full-service restaurants accounted for the recovery in year-to-date food services and drinking place receipts. Sales at special food services (including mobile and catering) as well as drinking places were down.
Trends
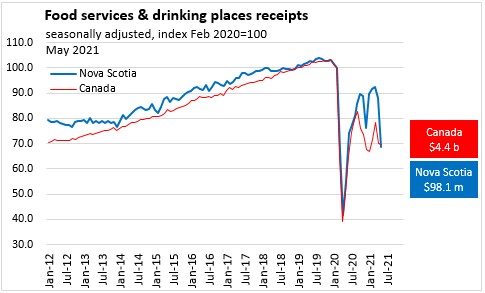
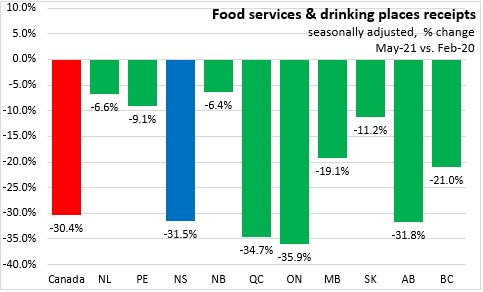
Nova Scotia's food services and drinking places receipts sales declined sharply in March 2020 (-32.4%) and April 2020 (-38.2%). Steady and rapid gains were reported from May through October of 2020. Nova Scotia experienced a short reversal in November and December 2020, but began to recover again from January through March before declining in April and May as new restrictions were imposed on another wave of COVID-19 infections. Compared to February 2020 Nova Scotia's May 2021 food services and drinking places sales were 31.5% below their pre-pandemic levels. National food services and drinking places sales were still 30.4% below their pre-pandemic levels.
Source: Statistics Canada. Table 21-10-0019-01 Monthly survey of food services and drinking places (x 1,000)
<--- Return to Archive