The Economics and Statistics Division maintains archives of previous publications for accountability purposes, but makes no updates to keep these documents current with the latest data revisions from Statistics Canada. As a result, information in older documents may not be accurate. Please exercise caution when referring to older documents. For the latest information and historical data, please contact the individual listed to the right.
<--- Return to Archive
For additional information relating to this article, please contact:
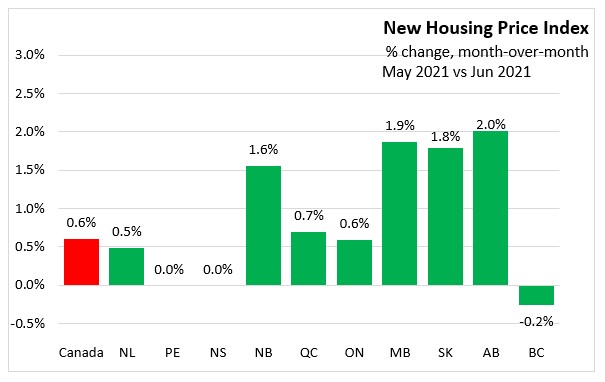
July 21, 2021NEW HOUSING PRICE INDEX, JUNE 2021 Month-over-month (Jun 2021 vs May 2021)
In Nova Scotia, the price of new housing remained unchanged from the previous month. Nationally, prices were up 0.6%. New home prices either stayed the same or increased in all 27 census metropolitan areas (CMAs) surveyed except for Vancouver where prices were down 0.3%.
The largest month-over-month increase was in Alberta (+2.0%). British Columbia (-0.2%) was the only province registering a decline in June.
Statistics Canada noted that while the housing sales remain record-high levels, the Canadian housing market started to show signs of moderation with June marking the third consecutive decline in new listings nationally. According to the Canadian Real Estate Association, sales activity declined in 92% of all local markets on a month-over-month basis.
Year-over-year (Jun 2021 vs Jun 2020)
Nos Scotia’s new housing prices increased 12.3% from the previous year in June. Nationally, prices were up 11.9%. All provinces posted gains led by Manitoba (+18.1%)

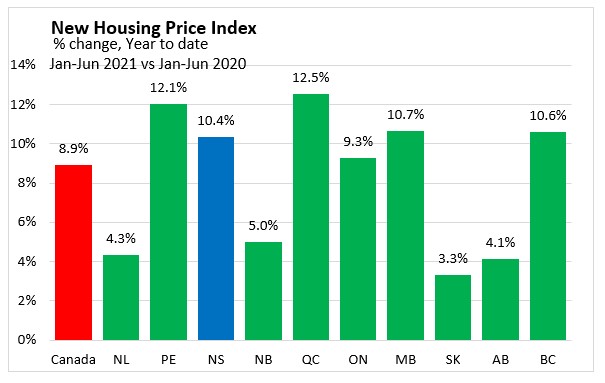
Year-to-date (Jan-Jun 2021 vs Jan-Jun 2020)
Nova Scotia’s new housing prices were up 10.4%, above the national average of 8.9% in the first half of 2021. Quebec (+12.5%) saw the fastest growth while Saskatchewan (+3.3%) reported the smallest increase from the same period last year.
Census Metropolitan Areas
Year-over-Year (Jun 2021 vs Jun 2020)
New house price growth among Census Metropolitan Areas was fastest in Kitchener-Cambridge-Waterloo (+27.7%) and Ottawa (+26.2%), with both CMAs posting the largest annual accelerations since the series began in February 1981. The slowest growth was in Sherbrooke (+1.3%). Nova Scotia's CMA, Halifax, reported a 12.3% increase.

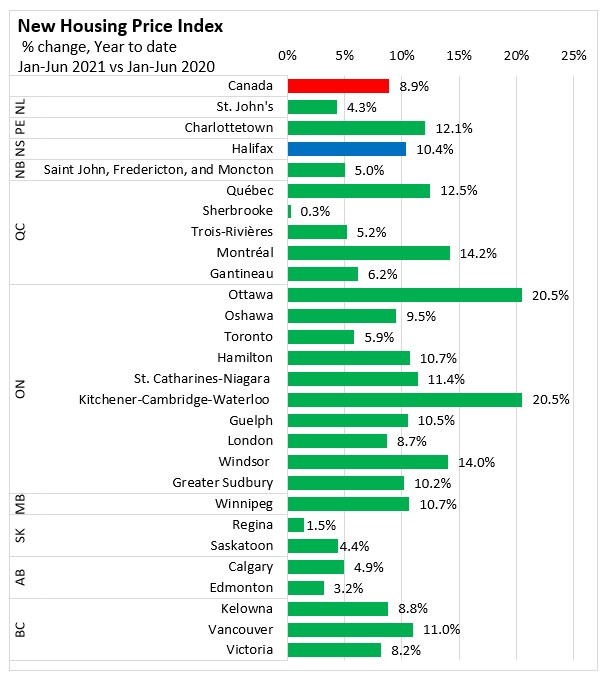
Year-to-date (Jan-Jun 2021 vs Jan-Jun 2020)
In Halifax, new housing prices increased 10.4% in the first six months of 2021 when compared to same period last year. New house price growth among Census Metropolitan Areas was fastest in Ottawa and Kitchener-Cambridge-Waterloo, both posting a gain of 20.5%. The slowest growth was in Sherbrooke (+0.3%) and Regina (+1.5%).
Source: Statistics Canada. Table 18-10-0205-01 New housing price index, monthly
<--- Return to Archive