The Economics and Statistics Division maintains archives of previous publications for accountability purposes, but makes no updates to keep these documents current with the latest data revisions from Statistics Canada. As a result, information in older documents may not be accurate. Please exercise caution when referring to older documents. For the latest information and historical data, please contact the individual listed to the right.
<--- Return to Archive
For additional information relating to this article, please contact:
July 20, 2021MARINE INDUSTRIES, 2014-2018 Statistics Canada has released a new study on the economic contribution of marine industries in Canada. The data are from 2014-2018 and were based on a report prepared by Gardner Pinfold for Fisheries and Oceans Canada.
Marine industries are defined as those that depend on the ocean, including:
- commercial fishing, aquaculture and fish processing
- offshore oil/gas
- marine transportation and related support activities
- recreational fishing/boating, cruise ships, coastal tourism
- ship/boat building
- port/harbour construction
- Department of National Defence, Fisheries and Oceans Canada, portions of other Federal/Provincial departments
- some activities of Universities and environmental non-governmental organizations
Direct employment in marine industries was 143,608 in 2018. Ocean-related tourism and recreation industries were the largest employer, followed by fishing/seafood, public sector/ENGO and transportation.
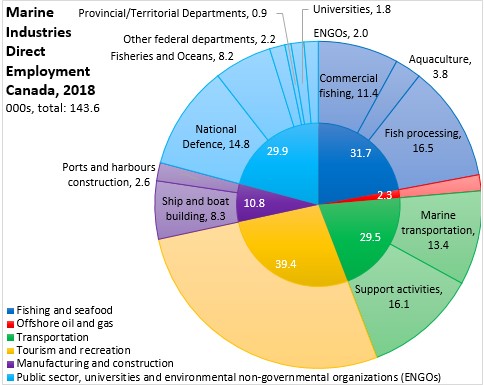
Marine industries generated $20.0 billion in GDP in Canada in 2018 (at current prices). Although it employed comparatively few people, offshore oil and gas was the largest marine industry contribution to GDP. This was followed by fishing/seafood, transportation, public sector/ENGO and tourism/recreation.

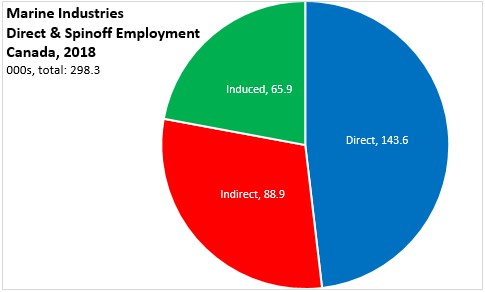
Using Statistics Canada's supply-and-use tables, the study also examined the impact that these industries have on upstream suppliers (indirect) as well as on communities where wages and salaries are spent (induced). These "spinoff" impacts employed more than the direct employment generated by marine industries themselves. Total employment (direct & spinoff) generated by marine industries amounted to over 298,000 in 2018 or 1.6% of the national total employment.
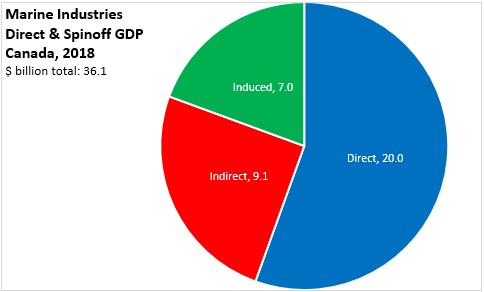
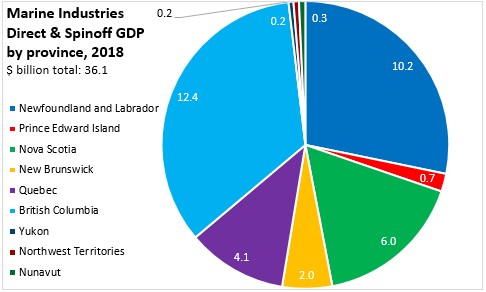
Including spinoffs, marine industries generated $36.1 billion in GDP in 2018 (current prices), which was also 1.6% of the national total.
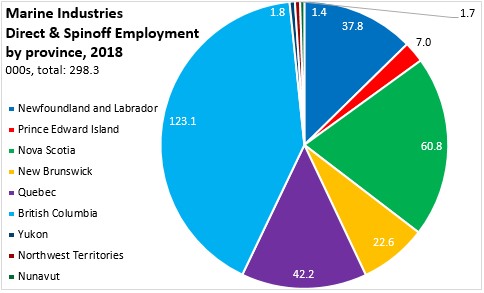
Marine industries are naturally concentrated in coastal areas with significant marine traffic. The Atlantic provinces, Quebec, British Columbia and the Territories accounted for most of Canada's marine industries.
The largest portion of Canada's marine industry employment (direct & spinoff) was located in British Columbia, followed by Nova Scotia, Quebec and Newfoundland and Labrador.
With a sizable offshore oil and gas industry, Newfoundland and Labrador's GDP (direct & spinoff) from marine industries was the second largest after British Columbia's. Nova Scotia's GDP from marine industries was $6.0 billion.
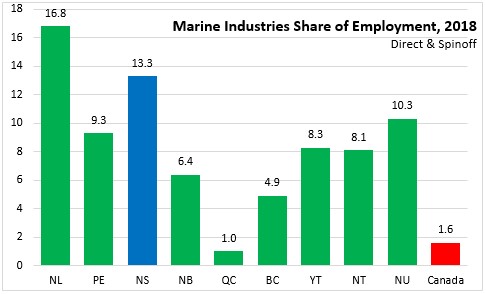
Measured as a share of total employment, marine industries (direct & spinoff) generated 13.3% of Nova Scotia's employment - the second highest share after Newfoundland and Labrador. Although it had the largest number of employees, marine industry employment in British Columbia was 4.9% of provincial employment.
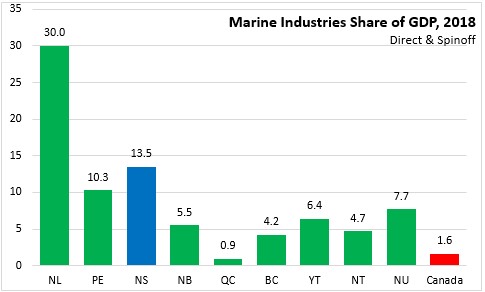
Marine industries (direct & spinoff) generated 13.5% of Nova Scotia's GDP, this was the second largest after Newfoundland and Labrador (30.0%) where offshore oil and gas makes a significant contribution.
Source: Statistics Canada. Study: Canada's Oceans and the Economic Contribution of the Marine Sector
<--- Return to Archive