The Economics and Statistics Division maintains archives of previous publications for accountability purposes, but makes no updates to keep these documents current with the latest data revisions from Statistics Canada. As a result, information in older documents may not be accurate. Please exercise caution when referring to older documents. For the latest information and historical data, please contact the individual listed to the right.
<--- Return to Archive
For additional information relating to this article, please contact:
May 03, 2021PROVINCIAL GDP BY INDUSTRY 2020 [PRELIMINARY] Statistics Canada released preliminary estimates of real GDP by industry for the provinces and territories in 2020.
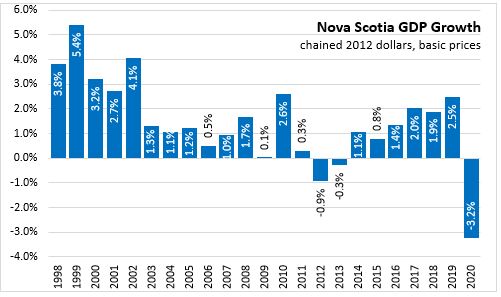
Real GDP growth is measured at the industry level with chained 2012 dollars at basic prices (sellers' prices before taxes less subsidies on products) that removes the effect of price changes. Nova Scotia's real GDP was estimated to have declined 3.2% during the COVID-19 pandemic, following six years of positive growth. Real GDP in 2020 was smaller than 2019 and 2018 but still larger than 2017.
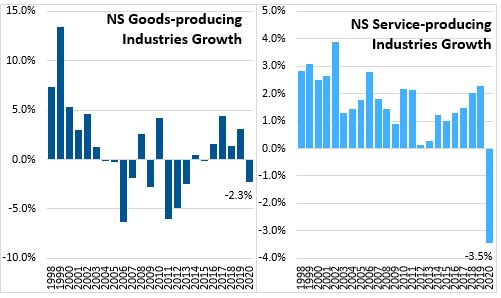
Goods-producing industries declined 2.3% in 2020. Service-producing industries declined 3.5%, the only annual decline in the data for 1997-2020 period.
In goods producing industries, real GDP declined in agriculture, forestry, fishing and hunting; utilities; and manufacturing while increasing in mining, quarrying and oil and gas extraction; and construction.
- Crop production was down 1.9% with licensed cannabis production nearly doubling that offset declines in unlicensed cannabis production and crop production excluding cannabis (-4.9%). Animal production (-5.6%) and aquaculture (8.5%) declined.
- Real GDP from forestry/logging (not including processing industries) was down 21.6 per cent in 2020 and support activities for forestry was up 14.1%.
- Fishing real GDP decreased by 3.6% in 2020.
- Output in mining/quarrying/oil/gas was up 4.2% with rising gold mining and stone mining and quarrying.
- Utility real GDP was down 6.5% with lower economic activity in the province.
- Construction real GDP was up 3.4% with residential building construction (+1.3%), transportation engineering construction (+24.1%), electric power engineering (+16.8%) offsetting lower non-residential building construction (-4.9%), and repair construction (-2.2%).
- Manufacturing real GDP declined 5.3%.
- Food manufacturing was down (-1.6%) with lower activity in seafood products (-3.1%). There were declines in most other categories including fruit and vegetable preserving and specialty food manufacturing, dairy products, and meat products. Soft drink (+11.3%), Breweries (+12.4%) and wineries/distilleries (+6.4%) gained in 2020.
- Sawmills real GDP was mostly unchanged (-0.2%) but pulp, paper and paperboard mills (-46.7%) declined with closure of Northern Pulp.
- Pharmaceutical (+33.2%), plastics (+2.5%), cement/concrete (+16.5%), structural metal (+7.7%), other electronic products (+17.8%), and medical equipment/supplies (+78.4%) had increases in activity in 2020.
- Rubber product manufacturing (-23.9%), industrial/commercial machinery (-13.2%), aerospace product/parts (-8.6%), shipbuilding (-10.3%) all declined in 2020.
Service-producing industries GDP declined by 3.5% with only finance and insurance; and real, estate and rental and leasing showing growth last year.
- Wholesale real GDP (-1.3%) declined with lower activity showing up mainly in food/beverage, personal and household goods and motor vehicles.
- Retail real GDP declined 2.5% with lower activity in motor vehicle and parts dealers (-17.5%), home furnishing stores (-6.6%), health and personal care stores (-1.2%), gasoline stations (-10.5%), clothing stores (-24.3%), sporting/hobby stores (-7.4%). Higher real GDP occurred with food stores (+3.4%), general merchandise (+4.5%), miscellaneous stores (+5.6%), and non-store retailers (+10.2%).
- Transportation and warehousing (-15.0%) declined with air transportation (-78.4%), rail transportation (-10.8%), truck transportation (-6.6%), urban transit systems (-39.9%), taxi (-46.9%), and other transit/sightseeing transportation (-42.0%) seeing significant reductions. Postal services was mostly unchanged (+0.6%) and couriers rose 7.1%.
- Information and cultural industries (-1.8%) was mixed with declines in publishing (newspapers, periodical, books), motion picture exhibition, motion picture production, broadcasting, and other information services and increases among software publishers, data processing/hosting, and telecommunication (+1.3%).
- Within finance and insurance (+5.2%) , activity increased for banks (+7.0%), credit unions (+7.9%), and insurance carriers (+3.8%), and financial investment services (+11.0%).
- Real estate (+3.6%) was positive with growth for lessors of real estate (+3.4%), owner-occupied dwellings (+2.9%), offices of real estate agents (+22.3%) while rental and leasing services (-22.7%) declined.
- Professional, scientific and technical services (-2.4%) declined and was lower in most subsectors including, accounting, architectural/engineering, specialized design, consulting, advertising and other professional, scientific and technical services. Legal services (+3.4%) and computer system design services (+3.7%) increased in 2020.
- Administrative and support, waste management and remediation services (-13.0%) declined in all subsectors
- Educational services (-3.7%) declined with elementary and secondary schools (-5.7%) seeing larger decline than universities (-1.0%) and community colleges (-2.2%).
- Health care and social assistance (-5.2%) declined in all subsectors except nursing and residential care facilities (+1.2%). The decreases for the subsectors were: Offices of physicians (-14.0%), dentists (-15.7%), and miscellaneous ambulatory health care services (-10.7%) and hospitals (-2.0%) , social assistance (including day care) (-8.2%).
- Arts, entertainment and recreation (-46.5%) had the largest decline in 2020, with a 57.5% drop in GDP from performing arts and spectator sports alongside a 38.9% decline in GDP from amusement and recreation.
- Accommodation and food services (-31.2%) was down with traveller accommodation (-49.8%) and food services and drinking places (-26.3%) seeing significantly less activity during the pandemic.
- Other services (except public administration) (-12.9%) as there was lower activity in all sub sectors including repair services, personal services, funeral services, dry cleaning, religious organizations, and civic and professional organizations.
- Public administration declined 0.7% in 2020 with higher Federal public administration (+0.6%) and defense services (+1.1%) offset by public administration declines among provincial (-0.7%), local/municipal (-5.6%) and Aboriginal (-2.8%).

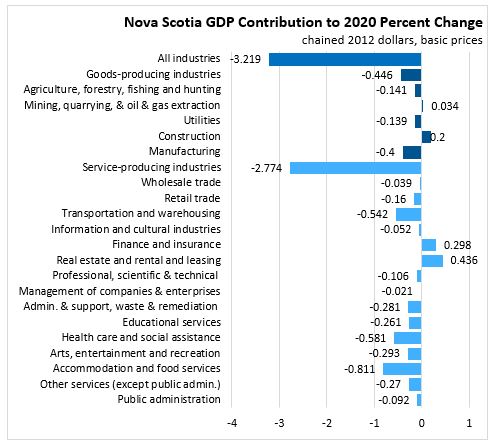
The largest contribution to the decline in real GDP in 2020 came from accommodation and food services, health care and social assistance, transportation and warehousing, and manufacturing
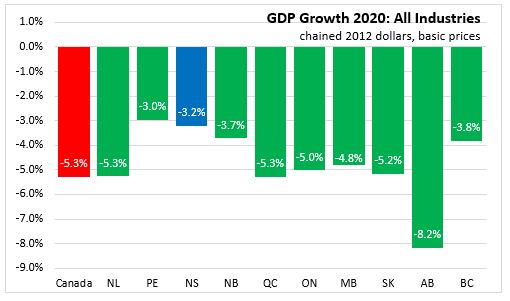
National real GDP at basic prices was down 5.3% in 2020. All provinces reported declines with the largest in Alberta (-8.2%) and the smallest in Prince Edward Island (-3.0%).
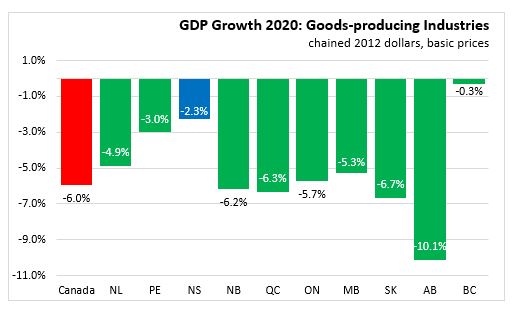
Goods industry real GDP declined 6.0% in Canada and 2.3% in Nova Scotia in 2020. All provinces reported declines with the smallest in British Columbia (-0.3%) and the largest in Alberta (-10.1%).
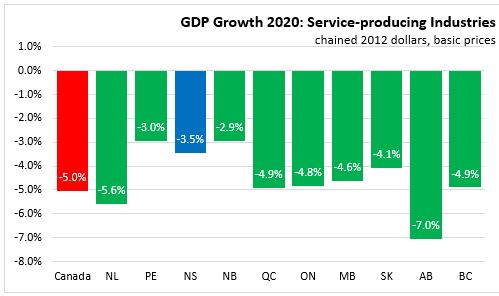
Service industry real GDP declined 5.0% in Canada in 2020 with a 3.5% decline in Nova Scotia . All provinces reported lower activity with the largest decline in Alberta (-7.0%) and the smallest in New Brunswick (-2.9%).
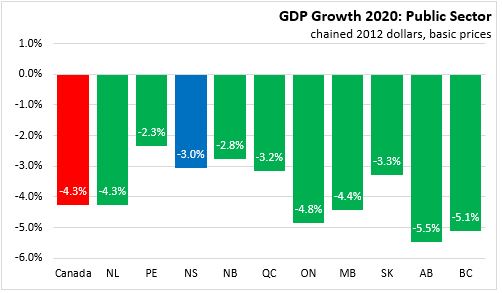
Public sector GDP (which is included in service industries) declined 4.3% in Canada and 3.0% in Nova Scotia in 2020. All provinces reported declines with the largest decline in Alberta (-5.5%) and the smallest in Prince Edward Island (-2.3%).
Source: Statistics Canada. Table 36-10-0402-01 Gross domestic product (GDP) at basic prices, by industry, provinces and territories (x 1,000,000)
<--- Return to Archive