The Economics and Statistics Division maintains archives of previous publications for accountability purposes, but makes no updates to keep these documents current with the latest data revisions from Statistics Canada. As a result, information in older documents may not be accurate. Please exercise caution when referring to older documents. For the latest information and historical data, please contact the individual listed to the right.
<--- Return to Archive
For additional information relating to this article, please contact:
March 26, 2021SOCIOECONOMIC PROFILE OF THE LESBIAN, GAY AND BISEXUEL POPULATION, 2015 TO 2018 Statistics Canada has been collecting data on sexual orientation with the Canadian Community Health Survey (CCHS) since 2003. Today, new data has been released from 2015-2018 on socioeconomic characteristics by sexual orientation (lesbian or gay, bisexual or heterosexual). The release today includes socioeconomic characteristics like marital status, children in the household, education, employment, household income, Indigenous identity, belonging to a population group designated as a visible minority group, language, place of residence.
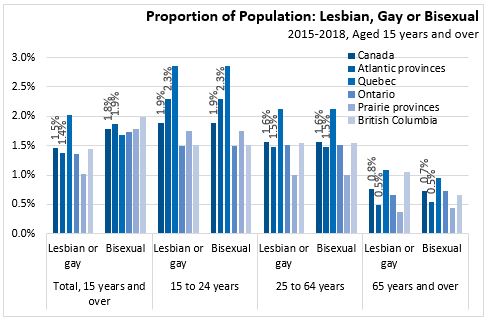
There was an estimated 900,000 Canadians that identified as lesbian, gay or bisexual (LGB). The LGB population represented 3.3% of the population aged 15 and older in the CCHS. Bisexual identify was 1.8% and lesbian or gay was 1.5%. Women were more likely to identify as bisexual than lesbian or gay (2.4% vs. 1.1%) and men were more likely to identify as gay than bisexual (1.9% vs. 1.2%).
Th LGB population was younger than the heterosexual population. The share of the population that identifies as LGB was 3.8% among those aged 15 to 24, 3.1% among those aged 25 to 64, and 1.5% among those aged 65 and over. The proportion of the population in each region that identified as LGB ranged from 2.8% in the Prairie provinces to 3.7% in Quebec.
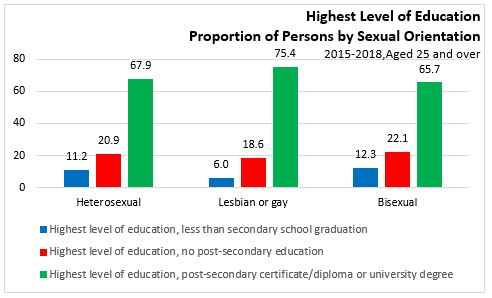
The proportion of the bisexual population with a post-secondary certificate/diploma or university degree was 65.7%, similar to the heterosexual population (67.9%). The lesbian or gay population had a higher proportion with post-secondary certificate/diploma or university degree (75.4%).
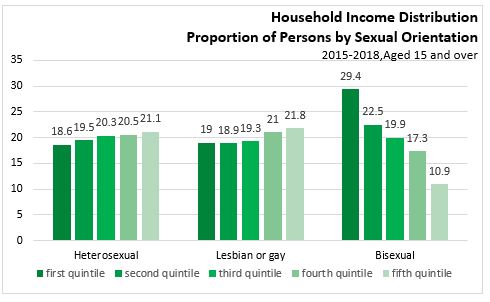
The income distribution was similar between the heterosexual and lesbian or gay populations with each income quintile (defined for the entire population) having around 20% in each quintile. The bisexual population was more likely to be in the lowest 2 quintiles than the top 2 quintiles, indicating lower income than the overall population.
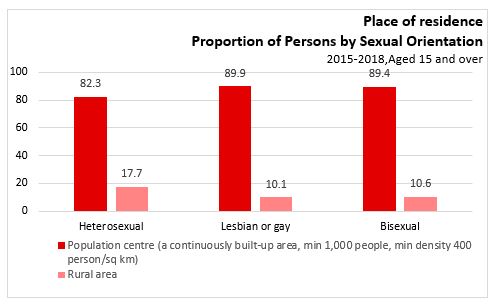
The LGB population was more likely to live in a population centre than the heterosexual population. Nearly 90% of both the lesbian or gay and bisexual population groups lived in population centre with the remain 10% living in a rural area.
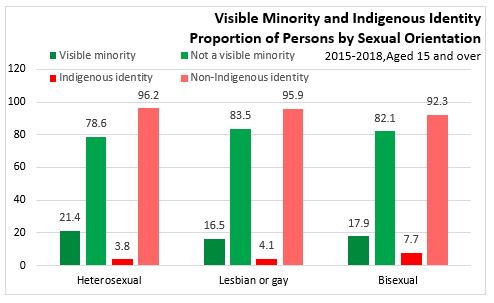
Belonging to a population group designated as a visible minority was less common for both the lesbian or gay (16.5%) and bisexual (17.9%) populations than the heterosexual population (21.4%). The proportion of the population that identified as Indigenous was similar for the heterosexual (3.8%) and lesbian or gay (4.1%) population and higher among the bisexual population (7.7%).
Statistics Canada: Socioeconomic profile of the lesbian, gay and bisexual population, 2015 to 2018
Statistics Canada. Table 13-10-0817-01 Socioeconomic characteristics of the lesbian, gay and bisexual population, 2015-2018
<--- Return to Archive