The Economics and Statistics Division maintains archives of previous publications for accountability purposes, but makes no updates to keep these documents current with the latest data revisions from Statistics Canada. As a result, information in older documents may not be accurate. Please exercise caution when referring to older documents. For the latest information and historical data, please contact the individual listed to the right.
<--- Return to Archive
For additional information relating to this article, please contact:
March 15, 2021HOUSING STARTS, FEBRUARY 2021 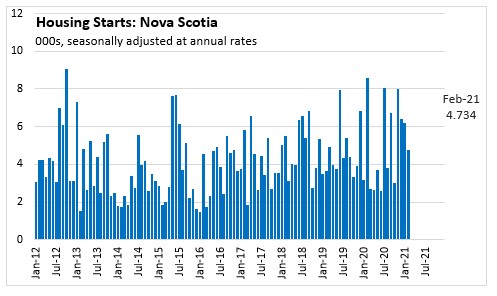
Nova Scotia’s housing starts (seasonally adjusted annualized rate) totalled 4,734 units in February 2021. This was 23.6% below the 6,194 units started in January 2021.
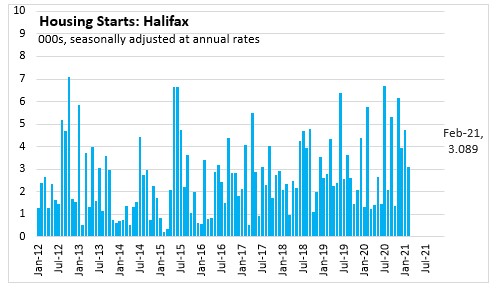
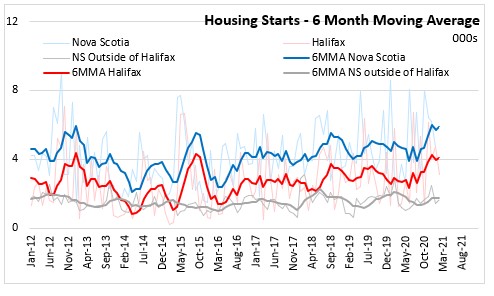
The monthly decline seen in February was due to lower starts in Halifax. Housing starts in Halifax decline 34.9% month-over-month to 3,089 units in February. Outside of Halifax, housing starts were up 13.6% from previous month and totalled 1,645 units in February.
Compared to the previous year, Nova Scotia’s housing starts were down 44.7% due to lower starts both in and outside of Halifax. Housing starts in Halifax decline 46.4% year-over-year while outside of Halifax housing starts were down 41.2% when compared to February 2020.

The six-month moving average of housing starts in Nova Scotia and Halifax was relatively flat through 2017. During 2018, the six-month moving average increased due to higher starts for multiples and declined after reaching a peak in September. The six-month moving average rose in the summer of 2019 due to trends in the Halifax market. For Nova Scotia, the trend has been negative in first half of 2020 and rose in the second half of 2020 due to declines in Halifax as well as outside of Halifax in first half, while within Halifax there has been an upward trend in second half of 2020 and within outside of Halifax there has been an upward trend since September 2020. Outside of Halifax, the six-month moving average was elevated through 2018 but has since returned to levels similar to those seen in 2017. Since the spring of 2019, the six-month moving average has been trending downward outside of Halifax with some increase in recent months.
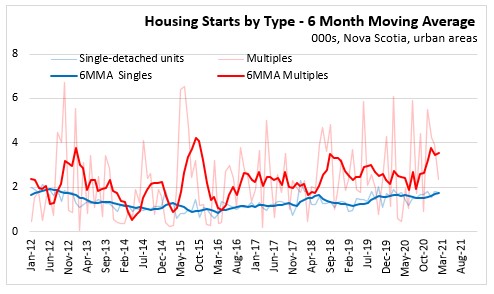
In urban areas, housing starts for multiples are generally higher than for singles with greater variability month-to-month. The six-month moving average for singles was relatively flat through most of 2019 and has been trending downward since May 2020 with some increase since October 2020. The six-month moving average for multiples rose during the summer months of 2018 and declined until the first quarter of 2019. Since then, the six-month moving average for multiples has been fluctuating with an uptick from September to November 2020.
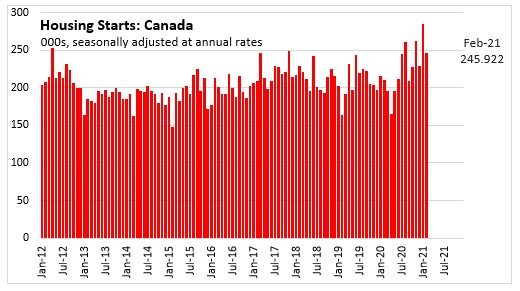
In Canada, housing starts declined 13.5% from previous month to 245,922 units in February 2021. When compared to February 2020, housing starts in Canada were up 17.1%.
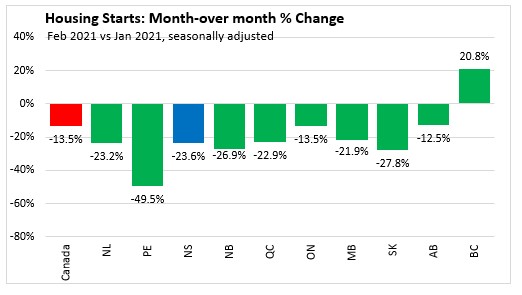
Housing starts declined in all provinces except British Columbia (+20.8%) from January 2021. Prince Edward Island posted the largest decline (-49.5%) followed by Saskatchewan (-27.8%).
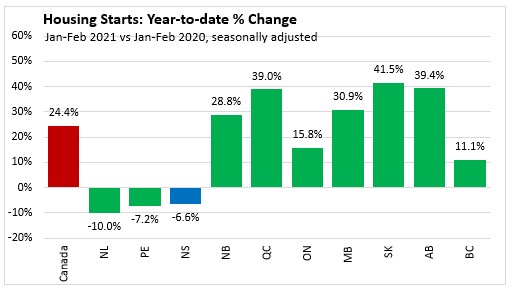
During the first two months of 2021, Canada’s housing starts increased 24.4% from the same period last year. Housing starts declined in three provinces year-to-date with Newfoundland and Labrador posting the largest decline (-10.0%) and Nova Scotia posting the lowest decline (-6.6%). The largest gain was recorded in Saskatchewan (+41.5%) followed by Alberta (+39.4%).
Note: Urban areas are defined as areas over 10,000 people
Source: Statistics Canada,
Table 34-10-0158-01 Canada Mortgage and Housing Corporation, housing starts, all areas, Canada and provinces, seasonally adjusted at annual rates, monthly (x 1,000)
Table 34-10-0156-01 Canada Mortgage and Housing Corporation, housing starts in all centres 10,000 and over, Canada, provinces, and census metropolitan areas, seasonally adjusted at annual rates, monthly (x 1,000)
<--- Return to Archive