The Economics and Statistics Division maintains archives of previous publications for accountability purposes, but makes no updates to keep these documents current with the latest data revisions from Statistics Canada. As a result, information in older documents may not be accurate. Please exercise caution when referring to older documents. For the latest information and historical data, please contact the individual listed to the right.
<--- Return to Archive
For additional information relating to this article, please contact:
February 11, 2021STUDY: TRENDS IN INTERGENERATIONAL INCOME MOBILITY AND INCOME INEQUALITY IN CANADA Statistics Canada recently released a study on the relationship between intergenerational income mobility and parental income inequality using Canadian tax data. The study looks at different periods to see if the inequality of parental incomes when a person is a teenager is related to how much intergenerational income mobility, people making more or less than their parents, occurs later on. The results show that Canada has been “going up” the Great Gatsby Curve and been experience rising parental income inequality and declining intergenerational income mobility over time; however, the study only looks at the correlation and not causality of the issue.
The Statistics Canada Intergenerational Income Database (IID) is used to track birth cohorts from the 1960s through the 1980s and observes parental income of the child when they are teenagers. There are 5 birth cohorts that each encompass the subsequent 3-year periods starting in years: 1963,1967,1972,1977,1982. In total there are nearly 6 million child-parent pairs. Income is measured from tax data based on the Canada Revenue Agency total income (including earnings, interest and investment income, self-employment net income, taxable capital gains/losses and benefits form public programs and transfers) for both parents during childhood and including spousal income during adulthood. A five-year average of parental income when the child is aged 15 to 19 years old is used to help reduce bias from transitory shocks, minimize the impact of divorce on the income measure, and allow the inclusion of the oldest cohort in the analysis. The child income in adulthood is measured as a five-year average when each cohort are the same age and is restricted to only those with average income of at least $500. All dollar figures are inflated to 2016 based on the all-item Consumer Price Index.
The parental and child income averages are computed as percentile ranks using the national distribution for most of analysis. The province of residence of the child is fixed based on data linkage to be the one where they were living at age 16 to 19.
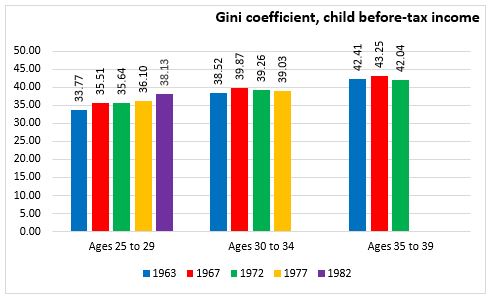
Descriptive statistics show rising inequality as measured by gini coefficient for both parental and the child income. The gini coefficient is a measure of inequality of an income distribution with 0 indicating complete equality, all people with the same income, and 1 indicating complete inequality with one person having all income. The parental before-tax income gini coefficient rose steadily through the cohorts from 36.36 for the 1963 child birth cohort to 44.37 for the 1982 child birth cohort. The children, when aged 25 to 29, had gini coefficient rising from 33.77 for the 1963 birth cohort to 38.13 for the 1982 birth cohort. Inequality measured when the child is aged 30 to 34 and 35 to 39 has moved both up and down in successive cohorts.
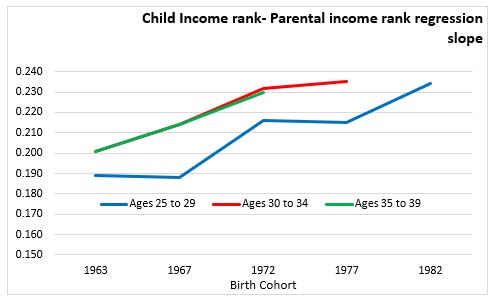
To measure intergenerational income mobility a regression of the ranking of the child income in adulthood by the income rank of their parents is used. A large slope from the regression, indicates the more parental income rankings explain child income rankings and thus less mobility has occurred. Additionally, the probability of a child transitioning to a different income quintile than their parental income distribution can be computed from the data, allowing measurements of cycles of poverty or transitions.
The own-income rank vs. parental income rank slope has increased in subsequent birth cohorts, indicating decreasing intergenerational income mobility. When measured for ages 25 to 29, the slope increased by 24% from 0.189 for the 1963-cohort to 0.234 for the 1982-cohort. The increase was for both sons and daughters. The upward trend also was evident for older ages among the cohorts that could be compared. Similarly, the transition between income quintiles show less movement with the more recent birth cohort. The probability of being in the bottom quintile when parental income was in bottom quintile increased from 0.27 to 0.33 between the 1963 and 1982 birth cohorts.
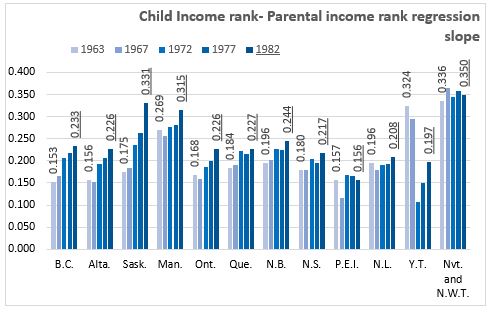
The child income rank -parental income rank regression is also estimated for the province and territories based on place of residence when the child was a teenager. A larger rank-rank slope indicates less intergenerational mobility than other regions or previous generations. Saskatchewan (89%), British Columbia (52%) and Alberta (45%) had the largest increases in the rank-rank slope between the 1963-cohort and the 1982-cohort. Yukon had the only decreases while Prince Edwards Island was mostly unchanged. The slope parameters were generally smaller in the Atlantic region, suggesting intergenerational mobility is higher. Nova Scotia rank-rank slope increased 21% from 0.180 for the 1963-cohort to 0.217 for the 1982-cohort.
The study presents the “Great Gatsby Curve” for Canada and the provinces, a comparison of the rank-rank slope measuring relatively mobility on the vertical axis with the Gini coefficient for parental income measuring income inequality on the horizontal axis. The movement in the graph up and to the right over subsequent cohorts indicates an increasing degree of income inequality and decreasing income mobility among children. The result is consistent with the literature on the negative relationship between inequality and mobility.

Statistics Canada: Trends in Intergenerational Mobility and Income Inequality
<--- Return to Archive