The Economics and Statistics Division maintains archives of previous publications for accountability purposes, but makes no updates to keep these documents current with the latest data revisions from Statistics Canada. As a result, information in older documents may not be accurate. Please exercise caution when referring to older documents. For the latest information and historical data, please contact the individual listed to the right.
<--- Return to Archive
For additional information relating to this article, please contact:
August 14, 2020MANUFACTURING SHIPMENTS, JUNE 2020
COVID-19 AFFECT ON SALES
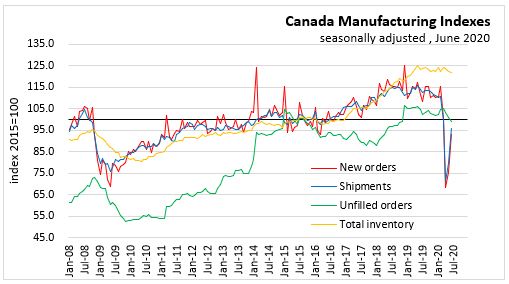
In Canada, "Manufacturing sales rose by a record 20.7% to $48.7 billion in June, following an 11.6% increase in May. Many factories operated at a much higher capacity in June, with the capacity utilization rate (not seasonally adjusted) for the total manufacturing sector increasing 10.9 percentage points to 73.3%.
Based on respondent feedback, the largest estimated impacts of the pandemic on manufacturing sales in dollar terms were in
- transportation equipment (-$1.1 billion),
- machinery (-$481 million),
- fabricated metal product (-$463 million),
- petroleum and coal product (-$385 million),
- food (-$319 million), and
- primary metal (-$260 million)"
Statistics Canada
CANADA
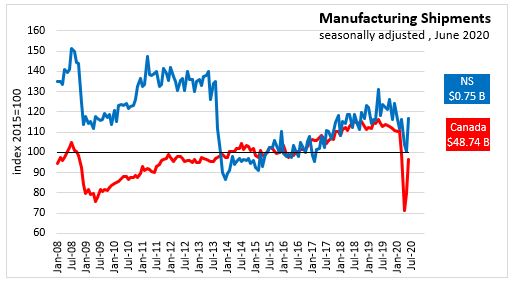
In Nova Scotia June 2020, seasonally adjusted Manufacturing Shipments increased 16.2% to $752.4 million over May 2020 and decreased 1.1% over June 2019.
In Canada June 2020, seasonally adjusted Manufacturing Shipments
- Compared to May 2020, overall sales decreased in 20 of 21 industries
- overall sales increased 20.7% to $48.7 billion over May 2020 and decreased 15.6% over June 2019
- Durable goods increased 34.1% to $25.5 billion over May 2020 and decreased 17.5% over June 2019.
- Non-durable goods increased 8.8% to $23.3 billion over May 2020 and decreased 13.5% over June 2019.
PROVINCES

On a seasonally adjusted, month-over-month basis, Manufacturing sales increased in 8 provinces. In June 2020 over May 2020, Ontario had the largest growth at 35.8%, Prince Edward Island shipment growth decreased 7.2%. Nova Scotia shipments increased 16.2%. In Canada shipments increased 20.7%.

On a seasonally adjusted year-over-year basis, Manufacturing sales declined in all provinces. In June 2020 over June 2019, Nova Scotia had the smallest decline -1.1%. Newfoundland and Labrador reported the largest decline at 54.5%. In Canada shipments decreased 15.6%.
NOVA SCOTIA SECTORS
Month-over-month seasonally adjusted
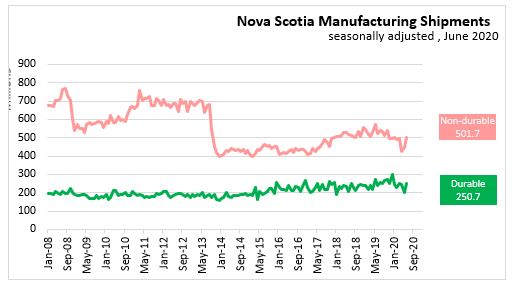
In Nova Scotia June 2020, seasonally adjusted Manufacturing Shipments increased 16.2% to $752.4 million over May 2020 and decreased 1.1% over June 2019. Durable shipments were up 12.2 per cent compared to May 2020 and are 4.1 per cent below June 2019. Non-durable shipments increased 25.3 per cent compared to last month and are 5.6 per cent higher than June 2019
Year-over-year Unadjusted
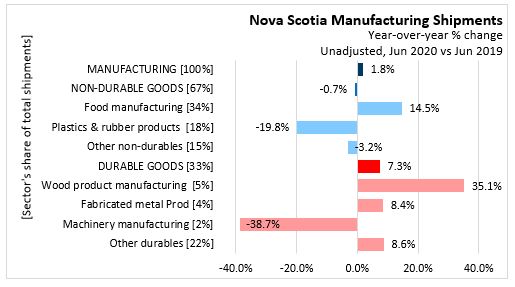
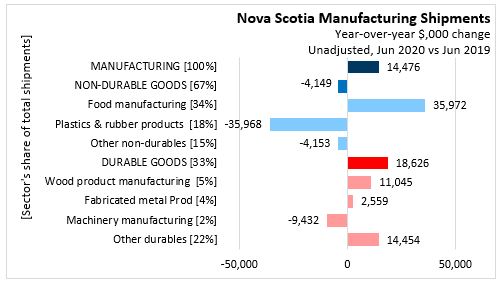
Unadjusted Year-over-year (Jun 2020 vs Jun 2019), Manufacturing Shipments increased 1.8% ($14.5 million).
- Non-durable goods shipments, accounting for 67% share of Manufacturing Shipments, decreased 0.7% (-$4.1 million).
- Food manufacturing with a 34% share of Manufacturing Shipments, increased 14.5% ($36.0 million).
- Plastics & rubber products with a 18% share of Manufacturing Shipments, decreased 19.8% (-$36.0 million).
- Other non-durables with a 15% share of Manufacturing Shipments, decreased 3.2% (-$4.2 million).
- Durable goods shipments, accounting for 33% share of Manufacturing Shipments, increased 7.3% ($18.6 million).
- Wood product manufacturing with a 5% share of Manufacturing Shipments, increased 35.1% ($11.0 million).
- Fabricated metal Prod with a 4% share of Manufacturing Shipments, increased 8.4% ($2.6 million).
- Machinery manufacturing with a 2% share of Manufacturing Shipments, decreased 38.7% (-$9.4 million).
- Other durables with a 22% share of Manufacturing Shipments, increased 8.6% ($14.5 million).
CENSUS METROPOLITAN AREAS (CMA) SECTORS
HALIFAX CMA

In Halifax, month-to-month/year-over-year,
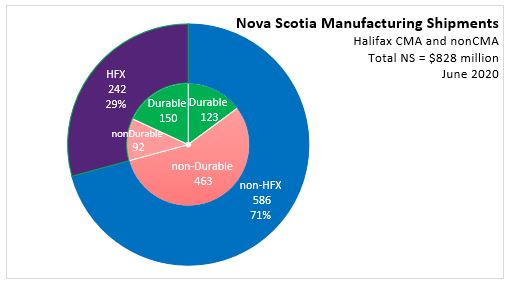
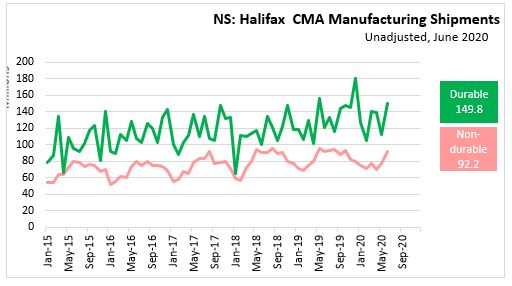
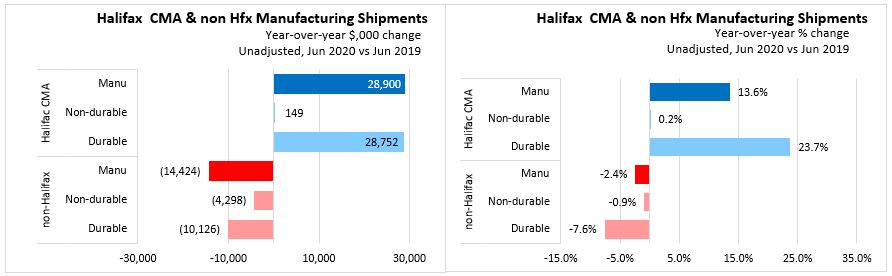
- unadjusted manufacturing shipments have increased 27.0% to $242.0 million over May 2020 and increased 13.6% over June 2019.
- Non-durable shipments have increased 18.3% to $92.2 million over May 2020 and increased 0.2% over June 2019.
- Durable shipments have increased 33.0% to $149.8 million over May 2020 and increased 23.7% over June 2006.
In the rest of Nova Scotia, month-to-month/year-over-year,
- unadjusted manufacturing shipments have increased 15.6% to $585.8 million over May 2020 and declined 2.4% over June 2019.
- Non-durable shipments have Increased 12.5% to $462.8 million over May 2020 and declined 0.9% over June 2019.
- Durable shipments have Increased 28.9% to $123.1 million overMay 2020 and declined 7.6% over June 2019.
During the COVID-19 pandemic, comparisons of year-to-date averages and sums do not show Nova Scotia’s rapidly changing economic situation. The DailyStats will focus on year-over-year comparisons, comparing one month with the same month in the prior year. Where possible the DailyStats will make comparisons of seasonally adjusted data from the pre-COVID-19 period (January and February 2020) with the period during which COVID-19 measures were in place from March 2020 onwards.
SOURCES
Statistics Canada Monthly survey of Manufacturing
Statistics Canada. Table 16-10-0047-01 Manufacturers' sales, inventories, orders and inventory to sales ratios, by industry (dollars unless otherwise noted)
Statistics Canada. Table 16-10-0048-01 Manufacturing sales by industry and province, monthly (dollars unless otherwise noted) (x 1,000)
Statistics Canada. Table 16-10-0011-01 Manufacturing sales, by industry for 12 Selected Census Metropolitan Areas (x 1,000)
<--- Return to Archive