The Economics and Statistics Division maintains archives of previous publications for accountability purposes, but makes no updates to keep these documents current with the latest data revisions from Statistics Canada. As a result, information in older documents may not be accurate. Please exercise caution when referring to older documents. For the latest information and historical data, please contact the individual listed to the right.
<--- Return to Archive
For additional information relating to this article, please contact:
July 10, 2020LABOUR MARKET TRENDS - JUNE 2020 Labour force survey results reflect the period from June 14 to 20, when public health restrictions had been substantially eased in most parts of the country. Business and workplaces continued to re-open with physical distancing and other requirements in place. Large gatherings continued to be limited.
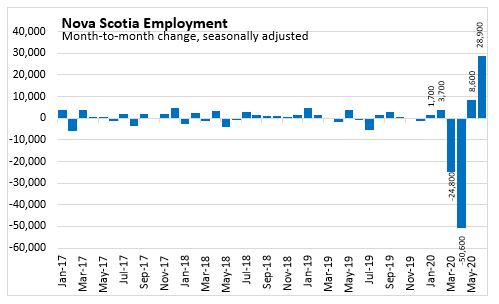
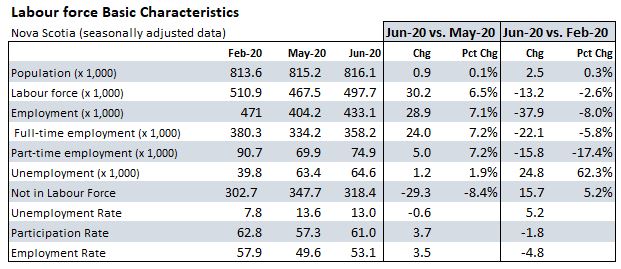
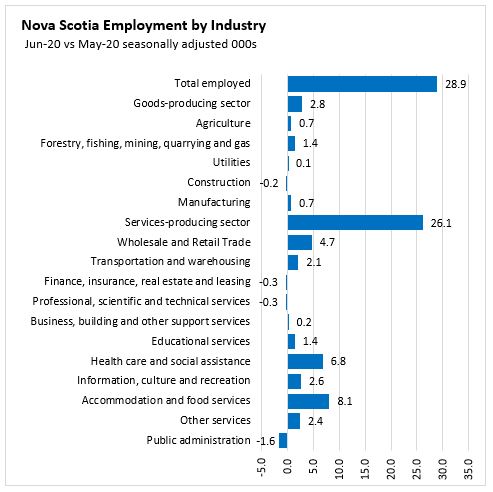
Nova Scotia's seasonally adjusted employment level was up 28,900 (+7.1%) in June following on the recovery of 8,600 jobs in May. Nova Scotia’s employment had previously declined 50,600 in April and 24,800 in March. The employment gain from May to June was the largest increase in the monthly data series that started in 1976.
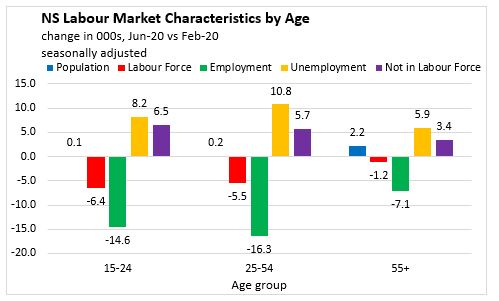
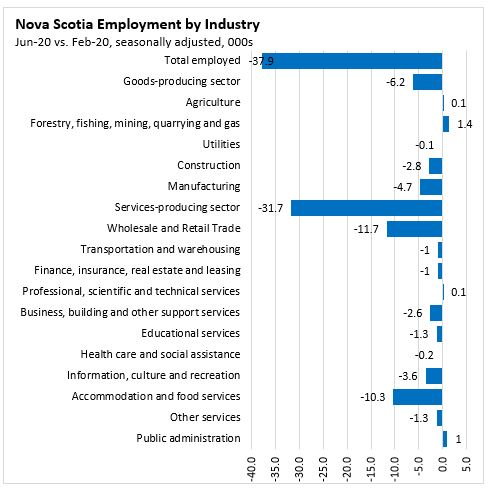
Nova Scotia’s employment remains lower by 37,900 (-8.0%) compared to February 2020 as the COIVD-19 pandemic and public health measures to contain it continue to impact the labour market.
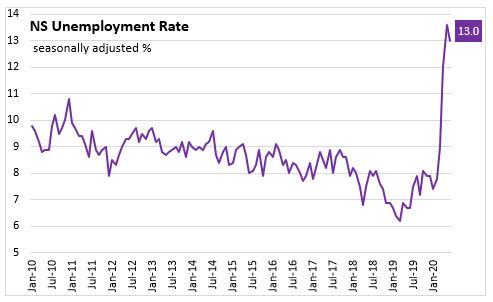
Nova Scotia’s labour force increased by 30,200 (+6.5%) to 497,700 for June, also the largest gain in monthly data going back to 1976. The labour force in June 2020 is smaller by 13,200 (-2.6%) than February 2020. The number of unemployed persons was down 1,200 in June and is 24,800 higher than February. With employment growing at a faster pace than labour force, the unemployment rate decreased 0.6 percentage points to 13.0 per cent June.
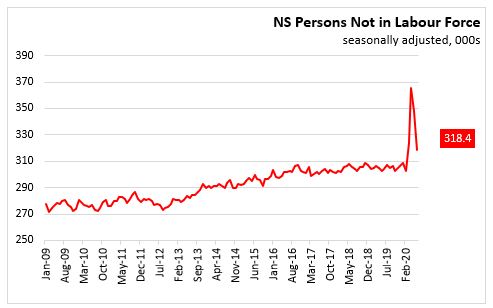
The population not in labour force fell 29,300 compared to last month. Compared to February 2020, there are an additional 15,700 persons not in the labour force and 24,800 unemployed.

In June, full-time employment increased by 24,000 (+7.2%) while part-time employment increased 5,000 (+7.2%). Employment since February 2020 is lower by 22,100 (-5.8%) in full-time jobs and -15,800 (-17.4%) in part-time employment.
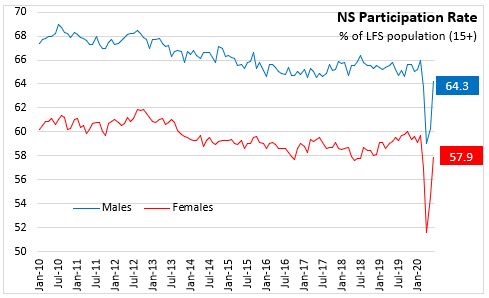
With the population steady (+0.1%) in June 2020, the rise in labour force lifted the participation rate 3.7 percentage points to 61.0 per cent. The participation rate remains 1.8 percentage points below the level observed in February 2020. The employment rate was up 3.5 percentage points to 53.1 per cent in June 2020 but remains -4.8 percentage points below February 2020.
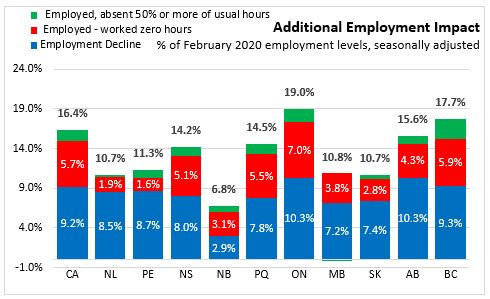
In addition to those who have lost employment since February 2020, there are elevated numbers of persons who are counted as employed, but had zero hours (and not for routine reasons like vacation, maternity/parental leave, labour dispute) or had their hours cut by 50 per cent or more. In June 2020 in Nova Scotia there were 48,700 person employed but at less than 50 per cent of their usual hours, down from 76,600 in May and up from 19,700 in February. Combined with those who have lost their employment, this amounts to about 14.2 per cent of Nova Scotia’s February 2020 employment level; down from 26.3 per cent in May. The largest total employment/hour impact in June 2020 was in Ontario at 19.0 per cent of February's employment level still experiencing an impact. The smallest change was in New Brunswick (6.8%).
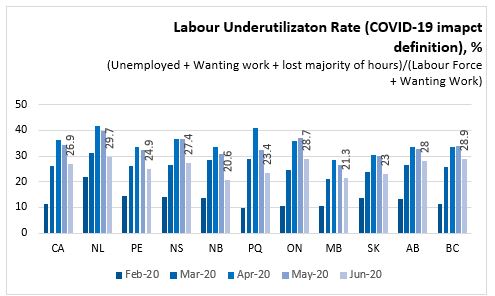
Statistics Canada reported in supplemental information that Nova Scotia had an increase of 18,400 (Feb-20 to Jun-20) of those who were not in the labour force but wanted to work. This is down from the 35,100 increase when comparing Feb-20 to May-20 The labour underutilization rate (COVID-19 impact definition) is the proportion of the potential labour force (labour force + those wanting work) that is unemployment, not in labour force but wanted work or employment who have lost the majority of their usual hours.
The rate increased in every province in March and April and then has started to come down in May and June. In February 2020, Nova Scotia's labour underutilization rate was 13.9 which increased to 36.8 per cent in April 2020 and declined to 27.4 per cent in June. The current highest labour underutilization rate is in Newfoundland and Labrador (29.7%) and the lowest rate is in New Brunswick (20.6%).
Age Cohorts
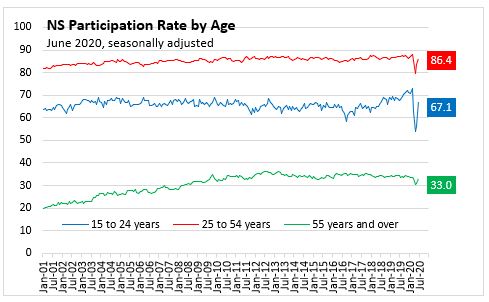
The June participation rate increased across all age groups from the previous month. The participation rate for younger Nova Scotians (15-24) increased 10.8 percentage points to 67.1 per cent in June – still 5.9 percentage points below the level observed in February 2020. For core aged Nova Scotians (25-54), the participation rate was up 3.0 percentage points to 86.4 per cent (down 1.5 percentage points since February), and for older workers the participation rate increased 2.2 percentage points to 33 per cent (down 0.5 percentage points since February).
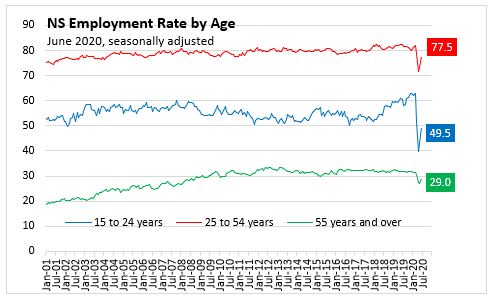
From May to June employment rates were up for youth (+6.6 percentage points), core-aged (+4.2 percentage points) and older workers (+1.8 percentage points). Compared with February, employment rates for youth were down 13.5 percentage points while employment rate were down 4.6 percentage points for core aged workers and 2.3 percentage points for older workers.
From May to June, unemployment rates increased 2.3 percentage points to 26.2 per cent for ages 15-24, decreased 1.8 percentage points to 10.3 per cent for ages 25 to 54, and increased 0.1 percentage points to 11.8 per cent for those over 55 in June 2020.
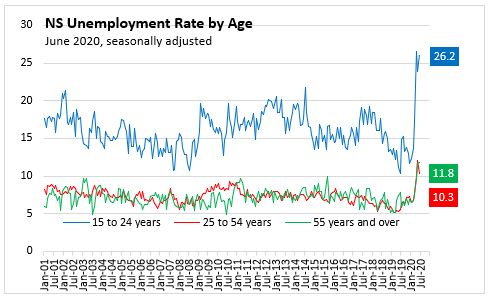
Comparing June 2020 to February 2020, the decline in employment mostly shows up in unemployment rather than in persons not in the labour force across all age groups.
Males and Females
For June 2020, the monthly participation rate increased by 4.0 percentage points among Males to 64.3 per cent and by 3.3 percentage points among Females to 57.9 per cent.
The employment rate was up 2.9 percentage points for Males in June and by 4.0 percentage points for Females.
The monthly unemployment rate increased by 1.0 percentage points among Males to 12.9 per cent but declined by 2.2 percentage points to 13.1 per cent for Females.

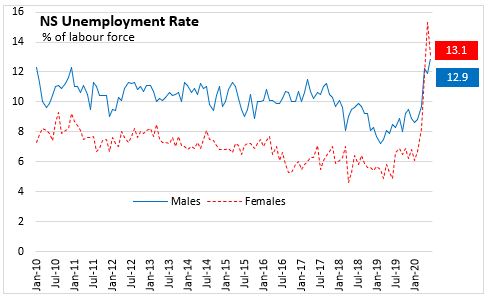
Compared with February 2020, male labour force is down 6,200 (-2.4%) while female labour force is down 7,000 (-2.8%). Male employment is down 15,900 (-6.7%) while female employment is down 22,000 (-5.8%). The number of unemployed is up 9,700 for males and 15,000 for females. The male population not in the labour force increased by 7,500 while the number of females not in the labour force grew by 8,300.

Sectors and Industries
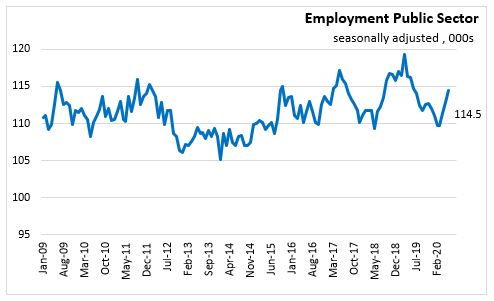
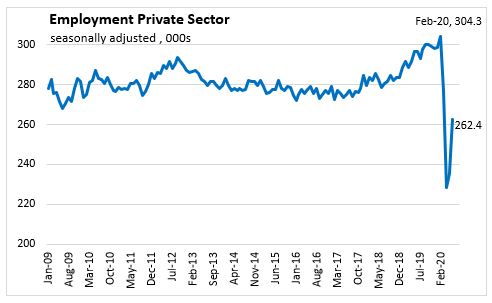
Monthly employment increases in June were mostly in the private sector (+26,700) which had the largest declines in previous months. Self-employment (500) and public sector employment (+1,700) also increased in June. Compared to February 2020, employment remains lower in private sector employees (-41,900) and self-employed (-1,000); public sector employees (+4,800) are higher. (Totals do not add due to rounding).
For June 2020, the monthly employment increases were seen in the goods-producing sector ( +2,800) with modest increases in all subsectors except construction. Services-producing employment recovered 26,100 jobs in June with the largest increases in accommodation and food services (+8,100), health care and social assistance (+6,800), and trade (+4,700). Other increases occurred in transportation, educational services, information, culture and recreation and other services.
Employment since February 2020 remains 6,200 lower in goods-producing industries with the lower employment levels concentrated in construction (-2,800) and manufacturing (-4,700). Service-producing employment is lower by 31,700 since February 2020 with the lower levels in wholesale and retail trade (-11,700) and accommodation and food service (-10,300) accounting for nearly 70 per cent of the total service sector decline. Employment levels in June 2020 are also lower in information, culture and recreation (-3,600), building, building and other support services (-2,600), other services (-1,300), educational services(-1,300), finance, insurance and real estate (-1,000) and transportation and warehousing (-1,000).

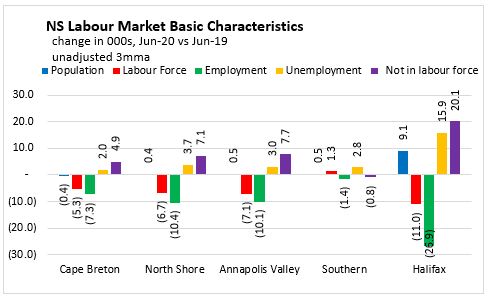
Regions – June 2020 vs. June 2019 (unadjusted 3 month moving average)
Comparing June 2020 with June 2019, Cape Breton employment is down 7,300 while the labour force decreased by 5,300. The number of unemployed increased 2,000 and the unemployment rate increased 5.1 percentage points to 18.6 per cent.
For the North Shore region, the labour force decreased by 6,700 while employment decreased 10,400. With labour force declining less than employment, the number of unemployed increased by 3,700. This caused a 6.0 percentage points increase in the unemployment rate from 6.9 per cent to 12.9 per cent. There are 7,100 more persons not in the labour force compared to last year.
The Annapolis Valley reported a decrease of 7,100 in labour force and employment falling 10,100. Unemployment was up 3,000 and the net result was an increase in the unemployment rate by 6.2 percentage points to 11.7 per cent. There are 7,700 more persons not in the labour force in Annapolis Valley compared to last year in June 2020.
The Southern region has a decrease of 1,400 in employment along with an increase of 1,300 in the labour force. The unemployment rate increased 5.0 percentage points to 12.3 per cent in June 2020.
Halifax experienced a decline of 11,000 in the labour force along with a decline if 26,900 in employment. With unemployment rising 15,900, there was an increase of 6.6 percentage points in the unemployment rate from 5.1 per cent to 11.7 per cent in Halifax. The number of persons not in the labour force increased 20,100 in Halifax compared to last year.

Provincial Comparisons
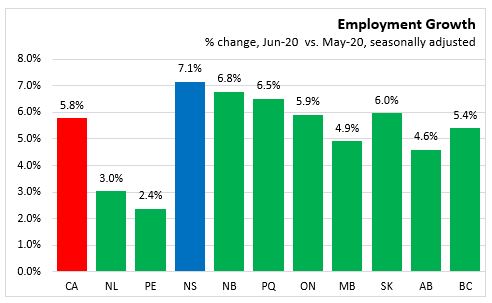
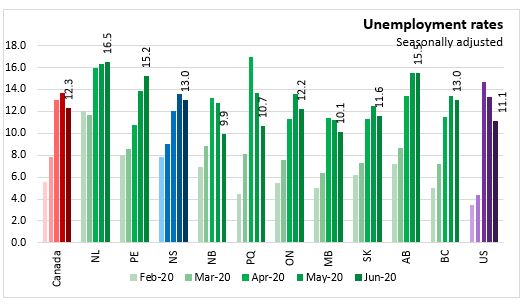
All provinces report increases in employment in June. The largest employment increases was in Nova Scotia (+7.1%) and nationally employment was up 5.8 per cent.
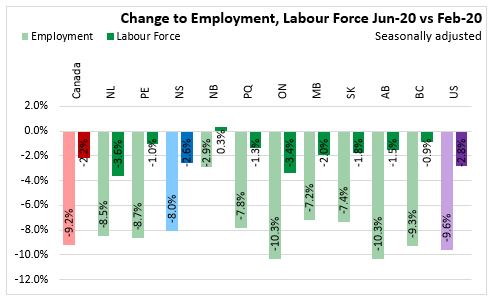
Compared to February 2020, the labour force remains lower in all provinces (except New Brunswick) and the US. The largest decline in the labour force since February 2020 has been in Ontario (-3.4%). The largest employment decline since February is in Ontario and Alberta (-10.3%) and the smallest decline has been in New Brunswick (-2.9%).
Unemployment rates declined in June 2020 for most jurisdictions. The highest unemployment rate for June 2020 is in Newfoundland and Labrador at 16.5 per cent and the lowest is in New Brunswick at 9.9 per cent. Canada’s unemployment rate was 12.3 per cent in June 2020.
National Comparisons: Cities (Monthly, 3 month moving average)
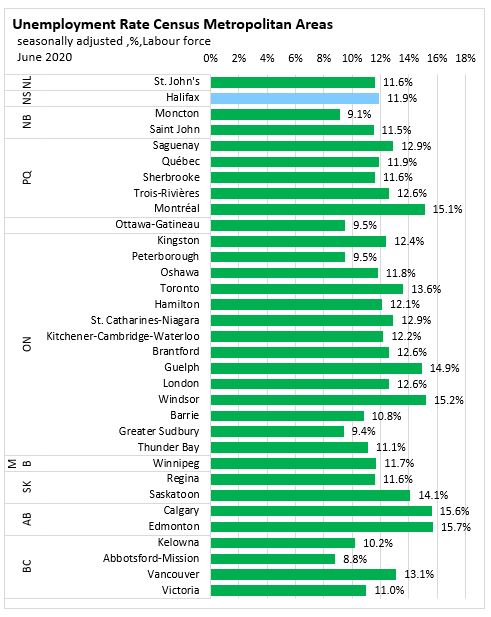
The unemployment rate for the Halifax Census Metropolitan Area (CMA) in June 2020 was 11.9 per cent (3 month moving average). Abbotsford-Mission at 8.8 per cent had the lowest unemployment rate among CMAs while the highest was in Edmonton (15.7 per cent).
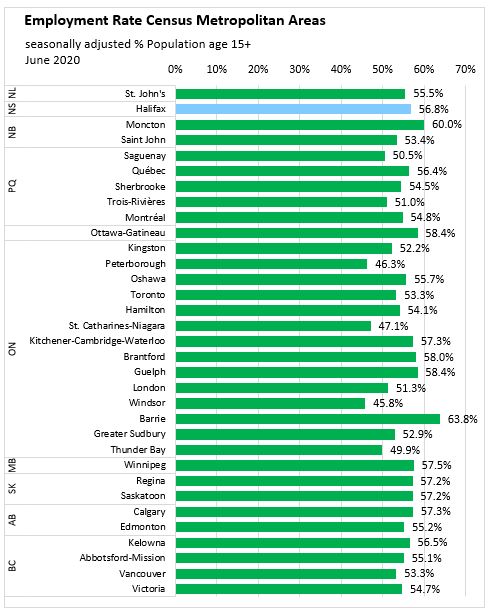
The seasonally adjusted employment rate for the Halifax was 56.8 per cent, unchanged compared to last month. Windsor, Ontario (45.8 per cent) had the lowest employment rate, while Barrie, Ontario (63.8 per cent) had the highest.
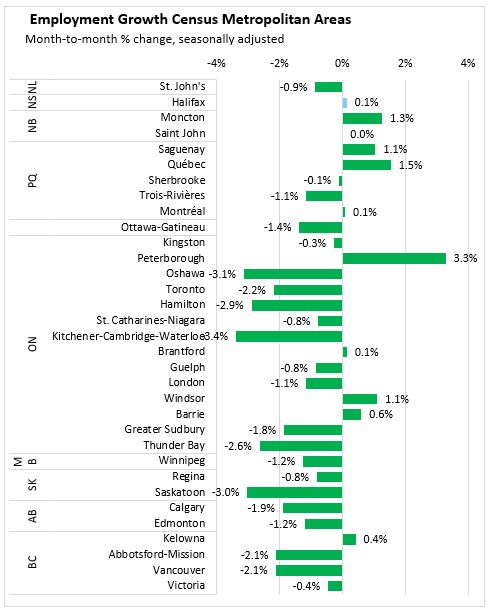
Halifax’s employment (3 month moving average) for June 2020 was up 0.1 percent compared to the May 2020 result. The largest declines in CMA employment was in Kitchener-Cambridge-Waterloo (-3.4%) and the largest employment growth was in Peterborough, ON (+3.3%).

Note: Seasonally adjusted, 3 month average.
Sources:
Statistics Canada. Table 14-10-0287-01 Labour force characteristics, monthly, seasonally adjusted and trend-cycle, last 5 months
Statistics Canada. Table 14-10-0294-01 Labour force characteristics by census metropolitan area, three-month moving average, seasonally adjusted and unadjusted, last 5 months
Statistics Canada. Table 14-10-0293-01 Labour force characteristics by economic region, three-month moving average, unadjusted for seasonality, last 5 months
Statistics Canada. Table 14-10-0355-01 Employment by industry, monthly, seasonally adjusted and unadjusted, and trend-cycle, last 5 months (x 1,000)
Statistics Canada. Table 14-10-0288-01 Employment by class of worker, monthly, seasonally adjusted and unadjusted, last 5 months (x 1,000)
<--- Return to Archive