The Economics and Statistics Division maintains archives of previous publications for accountability purposes, but makes no updates to keep these documents current with the latest data revisions from Statistics Canada. As a result, information in older documents may not be accurate. Please exercise caution when referring to older documents. For the latest information and historical data, please contact the individual listed to the right.
<--- Return to Archive
For additional information relating to this article, please contact:
June 16, 2020NATURAL RESOURCE INDICATORS, 2018 PROVINCIAL AND TERRITORIAL NATURAL RESOURCE INDICATORS, 2018
Statistics Canada has produced Provincial and Territorial Natural Resource Indicators (PTNRI) as an extension to the Natural Resources Satellite Account. The account defines natural resource activities as products and services originating from naturally occurring assets used in economic activity. The assets include mineral and energy resources, water, natural timber, aquatic and other natural biological resources but not agriculture. The indicators are built on the production/activity of the natural resource (including associated primary manufacturing) and not on an industry classification. The natural resource indicators include production, GDP, imports, exports and employment.
The natural resources sector accounted for 10.6 per cent of national GDP in 2018. The natural resource sector accounted for over 20 per cent of the economies of Newfoundland and Labrador, Saskatchewan and Alberta, and approximately 5 per cent of GDP in Prince Edward Island and Ontario. In Nova Scotia, the natural resource sector accounted for 6.1 per cent of GDP in 2018 with contributions among the sub-sectors of energy (2.0 per cent), forest (0.7 per cent), mineral and mining (0.9 per cent) and hunting, fishing and water (2.5 per cent).

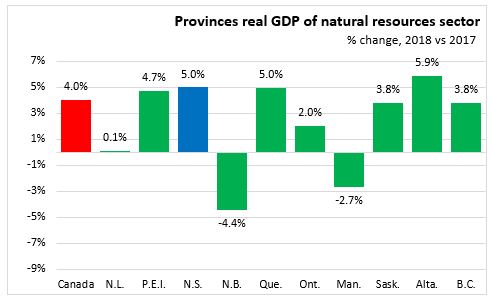
Nationally, natural resources real GDP rose 4.0 per cent in 2018. Natural resources real GDP rose in all provinces except New Brunswick (-4.4 per cent) and Manitoba (-2.7 per cent). The largest increase was in Alberta (+5.9 per cent) followed by Quebec and Nova Scotia (5.0 per cent).
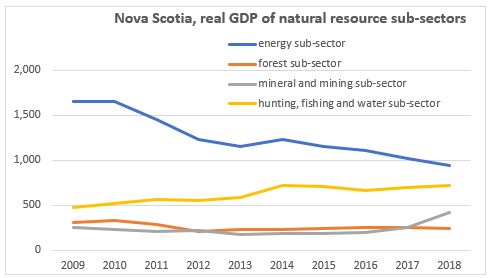
Nova Scotia natural resources real GDP declined from $2.7 billion in 2009 to $2.3 billion in 2018. The energy sub-sector decreased after 2014. Closure of the Dartmouth refinery reduced activity in the energy sub-sector. The forestry subsector saw a decline between 2010 and 2012 following the closures of pulp and paper mills. Real GDP of mineral and mining sub-sector had seen growth of 69.0 per cent and the hunting, fishing and water sub-sector had seen growth of 51.5 per cent since 2009.
Source: Statistics Canada: Table 36-10-0624-01 Provincial and territorial natural resource indicators, Natural resources sector (main indicators) (x 1,000,000)
Table 36-10-0222-01 Gross domestic product, expenditure-based, provincial and territorial, annual (x 1,000,000)
<--- Return to Archive