The Economics and Statistics Division maintains archives of previous publications for accountability purposes, but makes no updates to keep these documents current with the latest data revisions from Statistics Canada. As a result, information in older documents may not be accurate. Please exercise caution when referring to older documents. For the latest information and historical data, please contact the individual listed to the right.
<--- Return to Archive
For additional information relating to this article, please contact:
February 18, 2020FOOD INSECURITY 2017/2018 Statistics Canada has published updated indicators of food security and food insecurity. The data come from the 2017/2018 reference period of the Canadian Community Health Survey (CCHS), representing population averages over these two years.
This data now breaks out 'marginal food insecurity', which had previously been counted as part of 'food secure' households. Marginal food insecurity exists when (at some point during the reference year) there is a single indication of worry about running out of food and/or limited food selection due to lack of money for food. 'Moderate food insecurity' refers to households for whom there is a time during the year when the household had to compromise on the quality or quantity of food consumed. 'Severe food insecurity' exists in a year when there is reduced food intake or a disrupted eating pattern. A household is considered 'food secure' during a year if the household had access at all times throughout the year to enough food for an active, healthy life for all household members.
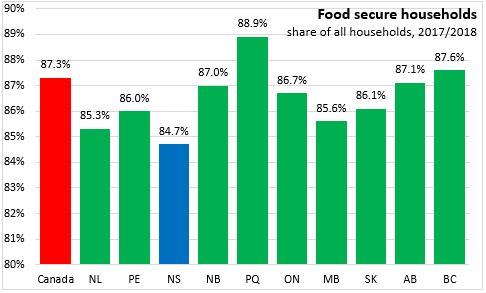
Across Canada, 87.3 per cent of all households are considered to be food secure. Quebec households are the most food secure at 88.9 per cent while Nova Scotia households are the least food secure at 84.7 per cent. Note that households in this data includes those whose living arrangement is 'living alone'.
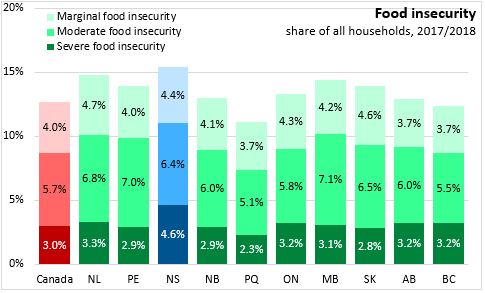
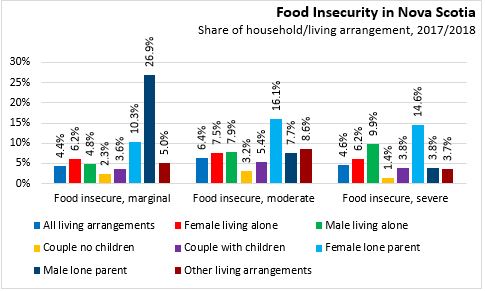
Food insecurity is classified into marginal, moderate or severe categories.
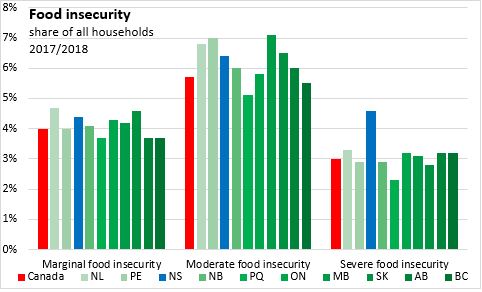
Across Canada, 3.0 per cent of households experience severe food insecurity. Nova Scotia has the highest share of severe food insecurity at 4.6 per cent of households. The lowest severe food insecurity is found in Quebec at 2.3 per cent.
Moderate food insecurity affected 5.7 per cent of households in Canada with the highest share in Manitoba (7.1 per cent) and the lowest in Quebec (5.1 per cent). Moderate food insecurity affected 6.4 per cent of households in Nova Scotia.
Marginal food insecurity affected 4.0 per cent of households across Canada, ranging from a high of 4.7 per cent in Newfoundland and Labrador to lows of 3.7 per cent in Quebec, Alberta and British Columbia. Among Nova Scotia households, 4.4 per cent experienced marginal food insecurity.
Food security varies by household type and living arrangement. In Nova Scotia, couple families report the highest food security - particularly among those with no children under 18 in the home. Lone parents report the least food security. Males and females living alone have lower than average food security.
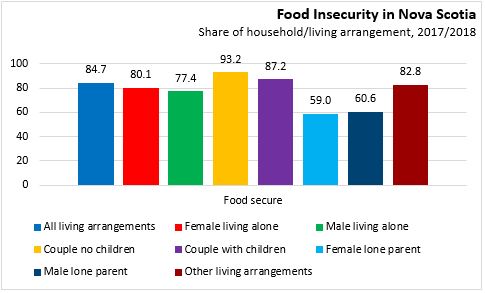
Food insecurity is highest among lone parent families: particularly marginal food insecurity for male lone parent families* and moderate-severe food insecurity among female lone parent families. Food insecurity is higher among Nova Scotians living alone. In particular, males living alone report higher prevalence of severe food insecurity.
Those living alone accounted for the largest number of households with food insecurity (24,900 of 61,100). Couples accounted for 17,100 food insecure households. There were 7,300 lone parent families in food insecurity, the vast majority of whom were female lone parent households (6,300). There were a further 11,800 households of other living arrangements experiencing food insecurity.

Background: Determining Food Security
Respondents are asked whether the following experiences were true for themselves or other adults in their household in the last year:
- You and other household members worried food would run out before you got money to buy more
- Food you and other household members bought didn't last and there wasn't any money to get more
- You and other household members couldn't afford to eat balanced meals
- You or other adults in your household ever cut size of meals or skipped meals
- You (personally) ever ate less than you felt you should
- You (personally) were ever hungry but did not eat
- You (personally) lost weight
- You or other adults in your household ever did not eat for whole day
In households with children, adult respondents are asked whether the following experiences were true for their household in the last year:
- You or other adults in your household relied on only a few kinds of low-cost food to feed child(ren)
- You or other adults in your household couldn't feed child(ren) a balanced meal
- Child(ren) were not eating enough
- You or other adults in your household ever cut size of any of the child(ren)'s meals
- Any of the child(ren) were ever hungry
- Any of the child(ren) ever skipped meals,
- Any of the child(ren) ever did not eat for whole day
Marginal food insecurity means there is no more than 1 affirmative response on adult or child food insecurity.
Moderate food insecurity means there are 2-5 affirmative responses for adults or 2-4 affirmative responses for child food insecurity.
Severe food insecurity means there are 6 or more affirmative responses for adults or 5 or more affirmative responses for child food insecurity.
In cases where a household meets the condition of two different classifications based on child/adult food insecurity, the household is given the more severe food insecurity status.
*Male lone parent food insecurity is suppressed for quality concerns as there are few male lone parent families in any sample of the population. Food insecurity for male lone parent families is calculated as a residual from totals and all other household/living arrangements and should be interpreted with caution.
Source: Statistics Canada. Table 13-10-0385-01 Household food security by living arrangement
<--- Return to Archive